Normalization uses an internal loading control to correct for unavoidable sample-to-sample and lane-to-lane variations.
Without Western blot normalization, you can’t know if changes in band intensity reflect biological change in your samples or variability in sample preparation, loading, and transfer. Normalization provides a baseline to compare changes in protein expression.
Normalization is necessaryfor comparing differences
“Oddly, the most pervasive challenges to published data we see at Cell relate to loading controls. There seems to be some misalignment among scientists regarding the importance and meaning of the actin bands in a standard western blot.”

Normalization corrects for some of the technique variability inherent to any Western blotting experiment, including:
A variety of normalization methods are available to correct for inherent Western blot variability. Choose and validate your internal loading control based on the context, biology, and goal of your experiment.
“…the loading control (the POI/LC ratio) is able to normalize for “loading errors” due to human error, incomplete transfer, or position effect on the blot.”
The core principle of accurate normalization is that the target and internal loading control signals must vary to the same degree with sample loading.2
Internal loading controls are endogenous proteins used to indicate sample concentration. Loading controls must be unaffected by experimental conditions.
Your normalization strategy should meet these requirements:
Choosing and validating an internal loading control that meets these requirements is fundamental to the design of an accurate Western blot.
“A difference between two samples could be the result of an actual difference in the [target], or a difference in the abundance of the LC.”
Normalize your target to a single, unrelated endogenous protein present in all samples. With this strategy, normalization is dependent on the accurate detection of a single protein. Be sure to validate that your housekeeping protein (HKP) is unaffected by experimental conditions or treatments in all of your samples, and that you’re detecting the housekeeping protein in the linear range of detection.
“House-keeping” proteins should not be used for normalization without evidence that experimental manipulations do not affect their expression.”
Many treatment conditions can affect HKP expression4, 5, 6, 7, 8, 9, 10, including:
“A recent mass spectrometry-based approach found that the protein expression levels of HKPs such as GAPDH vary substantially between tissues.”
Since many housekeeping proteins are highly expressed, they are at risk for saturation. Ensure that your housekeeping protein and your target have a common linear dynamic range. If your target expresses low signal intensities, it may be very challenging to detect both the housekeeping protein and target accurately. It helps if your detection system has a wide linear dynamic range.
Proteins with a similar molecular weight will migrate together on a blot. For ECL detection, this is a problem: each protein-antibody complex generates an identical signal (light). Co-migrating proteins can’t be distinguished from each other with ECL detection.
To detect different targets with the same molecular weight, use spectrally distinct fluorescent dyes attached to highly cross-adsorbed secondary antibodies. The signals can be detected simultaneously (often called “multiplexing”), then quantified separately.
“…in the typical loading range of 10-50 µg of cell lysate, quantitation of housekeeping proteins by immunodetection is not possible because they are in saturating quantities.”
If you choose to use a housekeeping protein as an internal loading control, validate its stable expression for your experimental conditions, including each tissue, treatment, and cell density. Housekeeping protein validation can be made quicker by using Empiria Studio® Software to guide you through analyzing your validation experiment. You’ll have immediate data to determine whether your housekeeping protein is suitable as a loading control.
See the table below for some published examples of variability. If you’re using chemiluminescent detection, choose a housekeeping protein with a different molecular weight than your target.
This following table has a few examples of some common housekeeping proteins, their molecular weights, and a few considerations. This list is not complete, and any housekeeping protein you choose should be fully validated for your system under study.
“Although we cannot prove that high-abundance loading controls are inaccurate under all possible conditions, we conclude that the burden of proof should lie with the researcher to demonstrate that their loading control is reflective of quantitative differences in protein concentration.”
| Housekeeping Protein | Molecular Weight | Note |
|---|---|---|
| COX IV | 17 kDa | Excellent choice for low-abundance target proteins. |
| Histone H3 | 17 kDa | Not suitable for experiments where the nuclear envelope has been removed. |
| PCNA | 36 kDa | PCNA is quickly degraded when DNA damage pathways are activated.4 |
| GAPDH | 36-38 kDa |
Not suitable for studies comparing normal and diseased placentas.5 Not suitable for differential expression studies on adipose tissue.6 May not be suitable for cross-tissue comparisons.7 |
| β-Actin | 45 kDa |
Not suitable for rat retinal development.8 May not be suitable for cross-tissue comparisons.9 |
| β-Tubulin | 52-55 kDa | Not suitable for comparing leukocytes from different age groups.10 |
| Lamin B1 | 68 kDa | Not suitable for experiments where the nuclear envelope has been removed. |
| Vinculin | 124 kDa | Can be used as a loading control for high molecular weight proteins. |
The target protein is used as its own internal loading control. Normalize a specific modification of your target against all target protein regardless of modification.
A single antibody detects an unmodified epitope on the target protein, accounting for the total amount of target protein present (sometimes referred to as a pan-specific antibody). A modification-specific antibody specific to that modification’s epitope detects just the modified form of the target protein. Modified signal is then normalized to the total level of target protein. Empiria Studio software automatically normalizes your target modification against the total target, regardless of modification, for you.
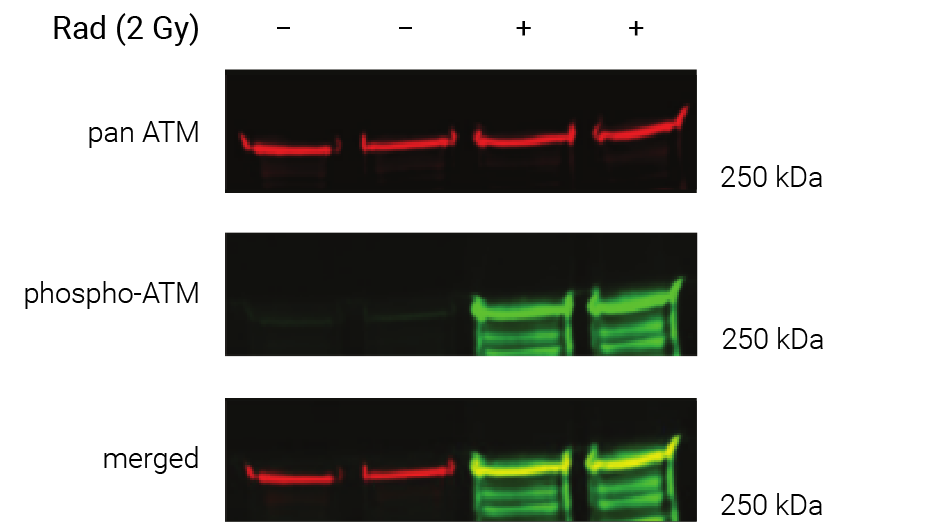
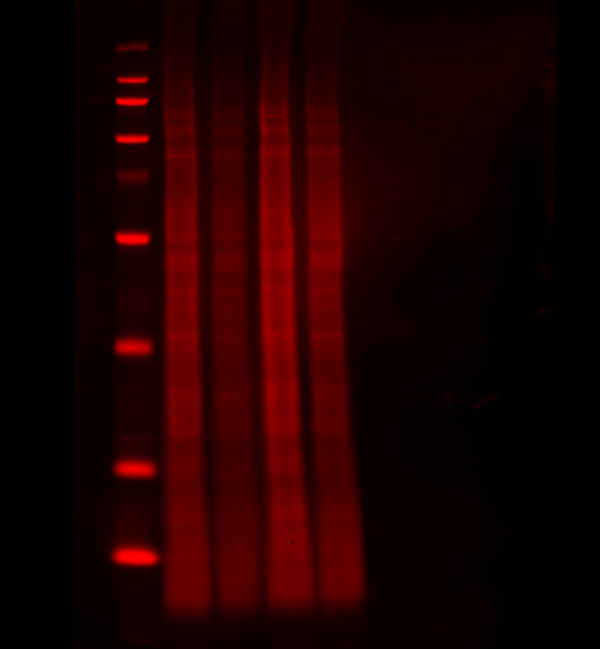
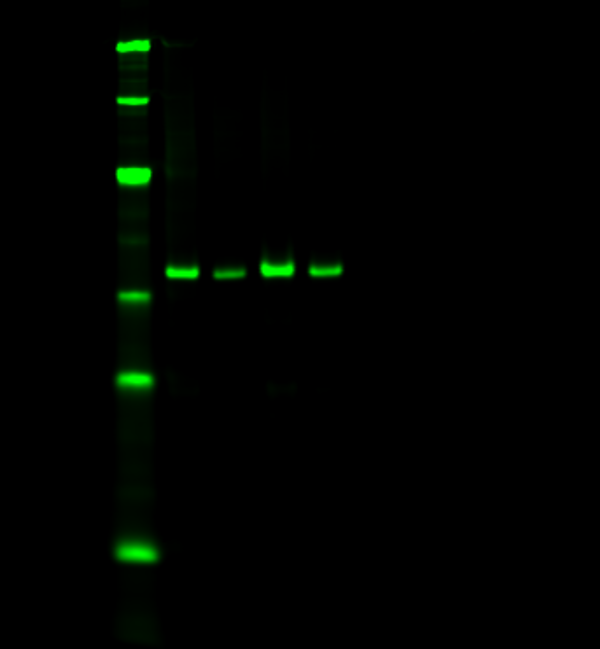
Figure 1. Phosphorylation of ATM used as its own internal loading control. H2AX phosphorylation was analyzed with multiplexed pan-specific and phospho-specific antibodies and fluorescent immunoblotting. γH2AX, the phosphorylated form of H2AX, is generated in response to DNA double-strand breaks. Bakkenist CJ et al. 2015. Oncoscience. 2(5): 542-554.
“Signals obtained using antibodies specific for phosphorylated epitopes should be normalized to the total protein level of the target protein.”
“Fluorescent tagged secondaries are also useful to analyze protein phosphorylation because, if they are generated in two different species, one color can be used to detect the total protein and another for the phosphorylated form.”
Normalize your target to the total amount of protein sample per lane. With a total protein stain, you can monitor protein transfer across the entire blot at all molecular weights. This will allow you to determine if there are any irregularities that indicate you should run the blot again to get more robust results. Quickly, calculate normalized signal using a total protein stain by letting Empiria Studio software automatically normalize your target data against the total protein.
Revert™ 700 Total Protein Stain is a membrane stain that fluoresces at 700 nm, and can be detected with a near-infrared fluorescence imaging system. With Revert 700 stain, you can detect targets in the 800 nm channel on the same blot, in the same lane, and at the same time.
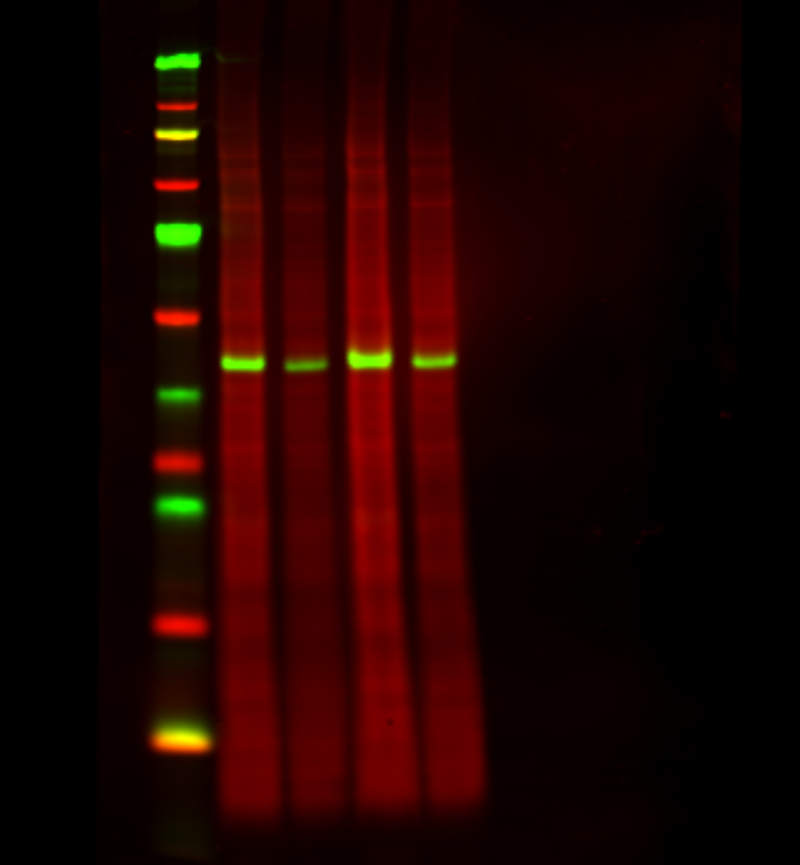
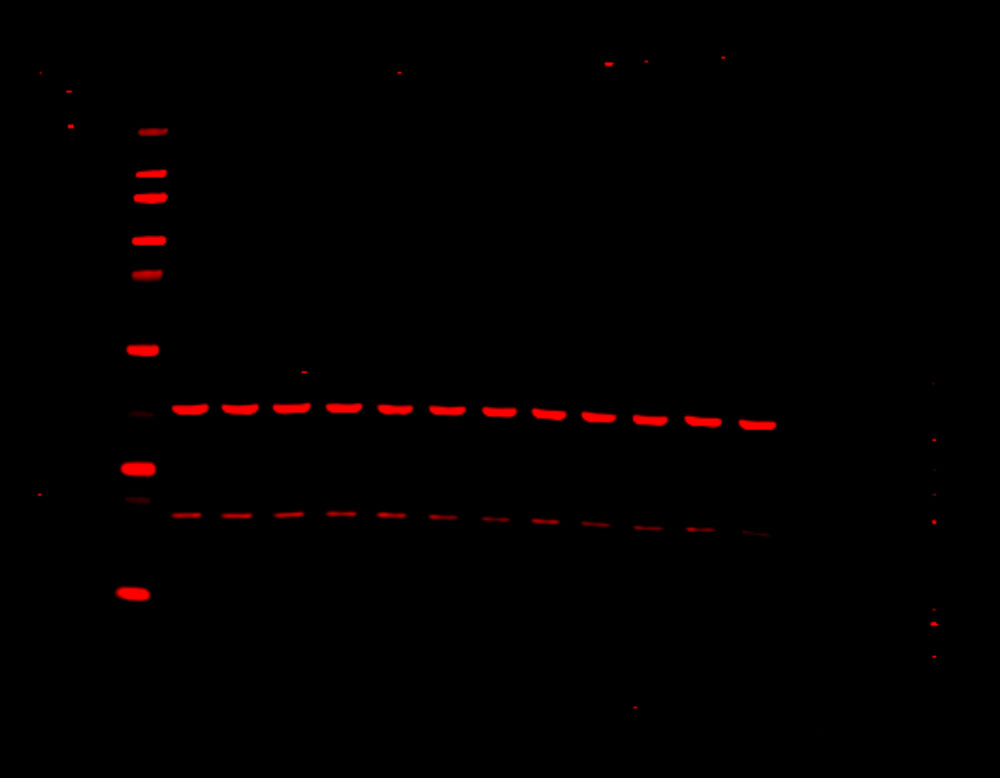
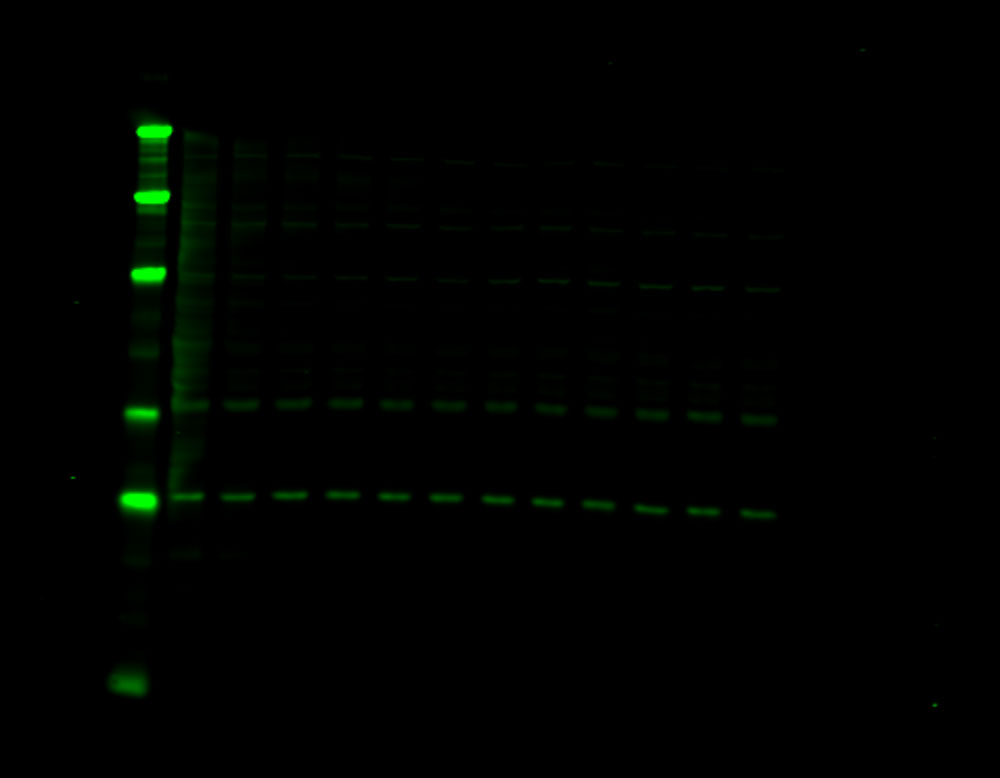
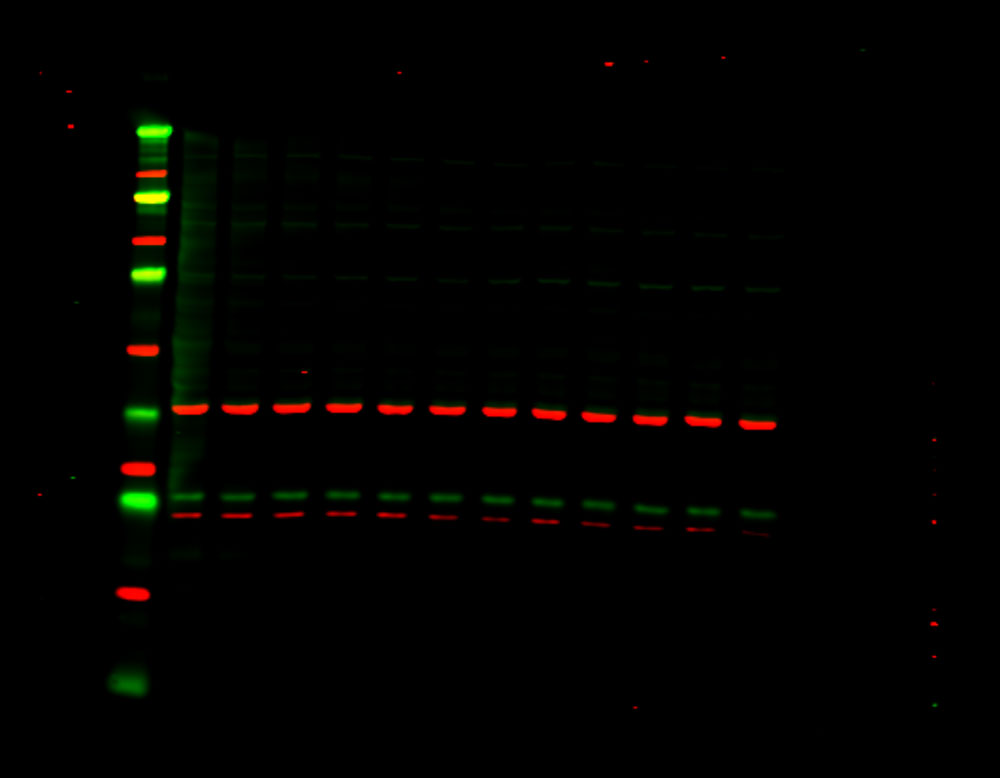
Figure 2. A total protein stain monitors consistent loading and transfer across the entire blot at all molecular weights. Revert 700 Total Protein Stain (700 nm, red) and the target ERK (800 nm, green) were detected in NIH/3T3 whole cell extract.
“The stained gel approach is a far more valuable loading control than that obtained by quantitating saturated signals from housekeeping proteins. The latter reveals little more than whether the sample was loaded or not.”
Signal from Revert 700 staining is proportional to sample loading. It stains total protein in individual lanes, with a potential linear detection range of 1-60 µg when used with cell lysate. However, individual proteins are easily detectable at low nanogram amounts.
Unlike Stain-Free™ technology or the Amersham WB System (CyDye labeling), Revert 700 Total Protein staining does not covalently modify sample proteins. Irreversible chemical modification (like with covalent labeling) can interfere with antibody binding and detection of your targets.
Unlike other total protein methods,Revert 700 won't covalently modify samples
“Normalization of signal intensity to total protein loading (assessed by staining membranes using Coomassie blue, Ponceau S or other protein stains) is preferred.”
This method uses a commercial pre-cast gel that contains trihalo compounds. UV light causes these compounds to irreversibly cross-link with tryptophan residues present in your sample. With UV light, you can then visualize the sample proteins either on the gel or on the membrane.
One limitation of this method includes chemical modification of your sample that may affect target detection and accurate normalization. If your target has many tryptophan residues, Stain-Free may block antibody to target binding, making accurate quantitation problematic.
In addition, UV imaging of the transferred membrane is much less sensitive than gel imaging, due to high autofluorescence of the membrane. Finally, many proteins do not contain tryptophan residues, and therefore will not be modified or detected. Stain-Free is more sensitive compared to Ponceau visible staining, but is still not as sensitive as near-infrared stains due to membrane autofluorescence.
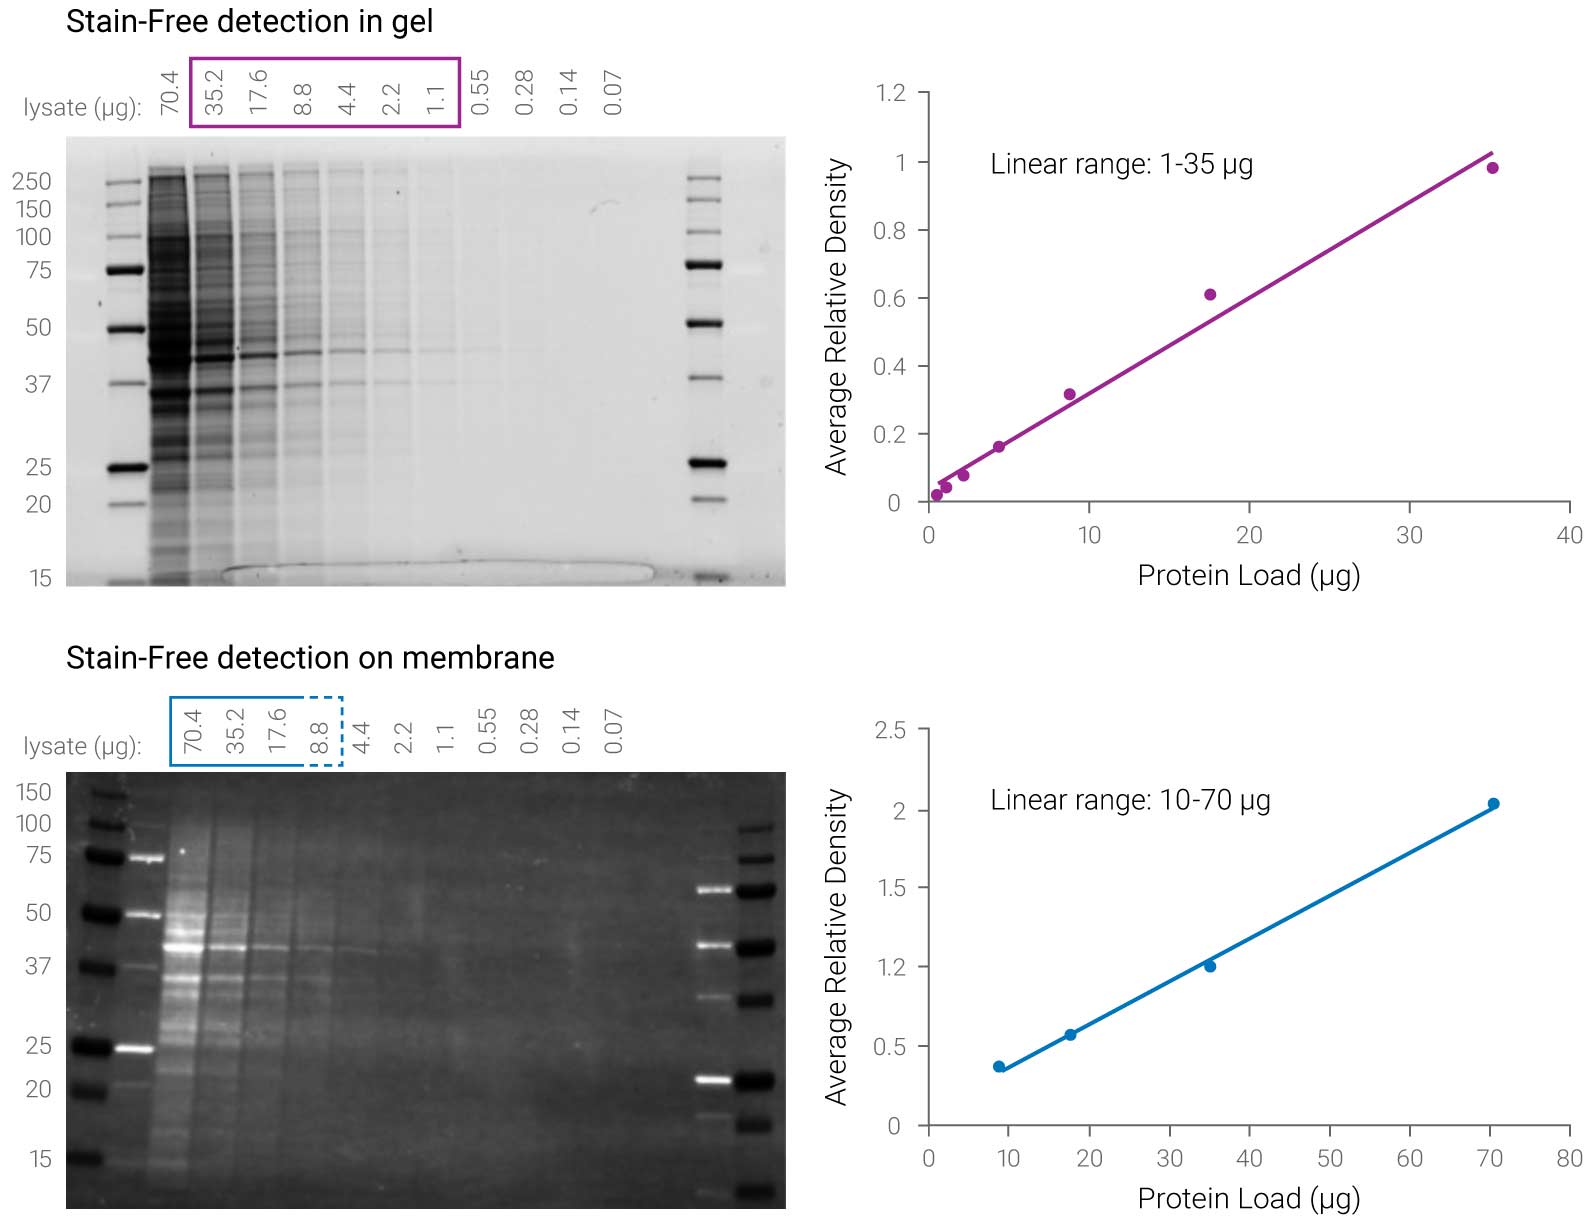
Figure 3. Stain-Free technology has a different linear range for gel and membrane detection. Stain-Free gel detection with UV light has a 35-fold linear dynamic range (1–35 µg) compared to UV detection on the membrane with a linear range of only 7-fold (10–70 µg). Taylor SC et al. 2013. Mol Biotechnol. 55:217-26.
“However, quantitative analysis of the band intensity indicates that the blots from gels activated with the Criterion Stain Free system have a reduced chemiluminescent signal when a mAb specific for an epitope that contains a Trp residue is used. Mean reduction of intensities of 79% and 78% were seen for all dilutions of the 12H12 mAb and 3E5 mAb, respectively. This suggests that chemical modification of Trp induced by UV exposure during the activation step of the Criterion Stain Free imaging process interferes with recognition by antibodies when the epitope contains Trp.”
In this method, a fluorescent dye labels all the proteins in your sample. This amine-reactive fluorescent dye covalently binds to the lysine residues in your sample proteins.
Limitations of this method include:
“Furthermore, the order of stains and antibodies should be tested to ensure that prior steps do not affect subsequent binding.”
Some researchers run replicate gels and stain one of the gels with a stain, like Coomassie. Staining a gel (rather than a blot) does not account for transfer variability, and is not a direct reflection of what is going on with the membrane containing proteins that will be quantified and analyzed. Replicate gel staining also requires a separate gel run and imaging.
LI-COR provides products, protocols, and support for Western blotting (and a range of other assays) that help reduce variability and increase replicability. Let us know how we can help you.
Get in Touch