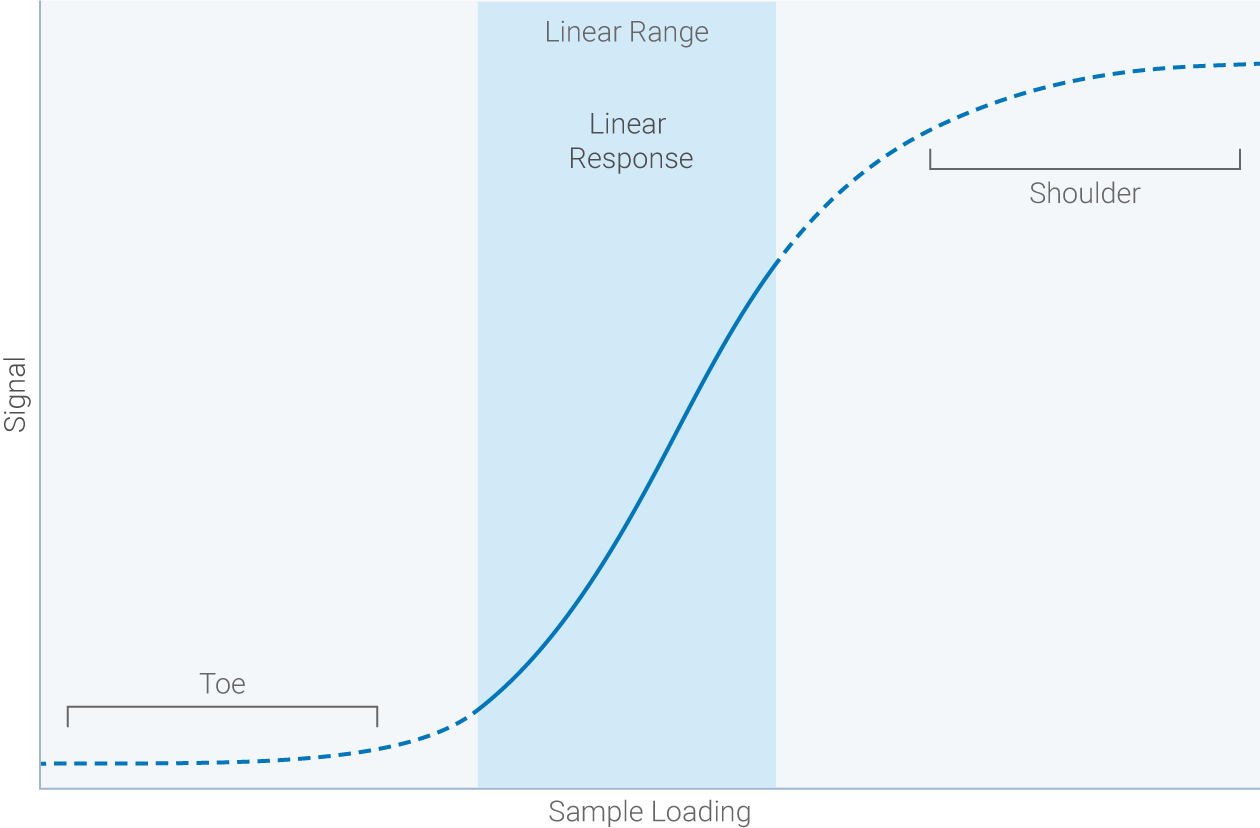
Outside the linear range of detection, the relationship between the amount of protein on the blot and the measured signal is unknown. Your relative measurement of protein amount is then not representative of a significant, quantitative value. So what exactly is the linear range, and how is different from dynamic range?
Linear range: the span of signal intensities that display a linear relationship between amount of protein on the membrane and signal intensity recorded by the detector.
Dynamic range: the range of band intensities the detection system can measure in a single capture.
High sensitivity without saturation is the key to a wide linear dynamic range.
Targets shouldn’t be quantified or compared outside the linear range of detection. A wide dynamic range makes it easier to produce Western blot data within the linear range. An ideal detection system picks up faint signals without saturating strong signals. Empiria Studio® software handles the complex math required to determine your combined linear range and creates an easy-to-read graph showing your optimal range of sample loading.
Wide dynamic range:High sensitivity without saturation
“…authors should clearly explain how quantitative data were obtained, whether signal intensity has a linear relationship with antigen loading, and how protein loading was normalized among lanes.”
With saturation, band intensity may appear different, but relative signal intensity plateaus. Strong signals can exceed the capacity of some detection systems to show differences in band intensity, creating saturated bands. The ideal detection system will be able to accurately capture both strong and faint bands in a single image. Here we give some common causes of saturation, and how to avoid them.
“Saturated immunoblots do not overestimate a change in protein; instead, they can substantially underestimate it.”
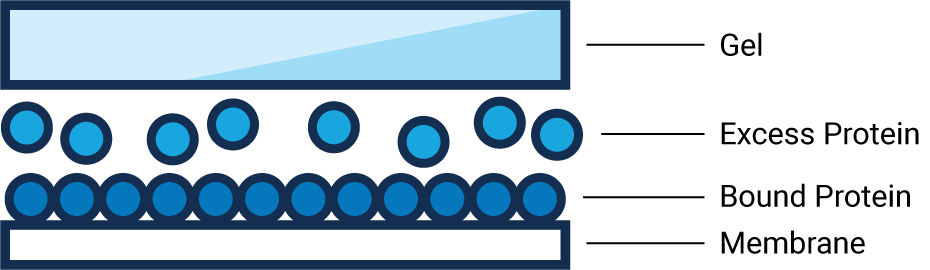
“Under certain conditions, loading large amounts of protein samples may actually decrease the relative amount of low abundance proteins that bind to nitrocellulose and polyvinylidene difluoride membranes due to saturation of the membrane by highly expressed proteins.”
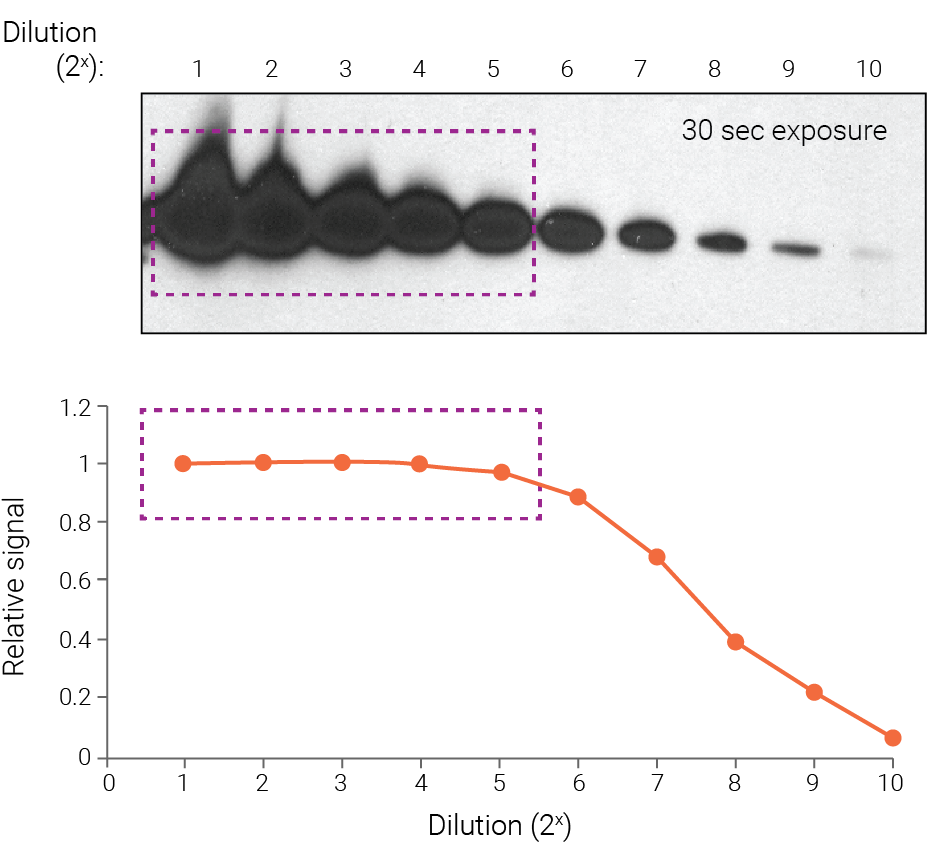
Figure 1. On film, strong bands become saturated and underestimate protein abundance. Purified Akt was detected with chemiluminescence and 30-sec film exposure, followed by densitometry. Strong bands display saturation (boxed regions) because they fall outside the linear range of detection. Band intensity is no longer proportional to protein abundance, and the signal intensity of these bands appears similar. Wang et al (2011) Proteome Sci. 9:53.
“Using film to perform quantitative immunoblotting was avoided entirely, because the dynamic range of film is so small that quantitative analysis is virtually impossible.”
“When chemiluminescence is used cavalierly, there is a danger of wildly exaggerated claims.”
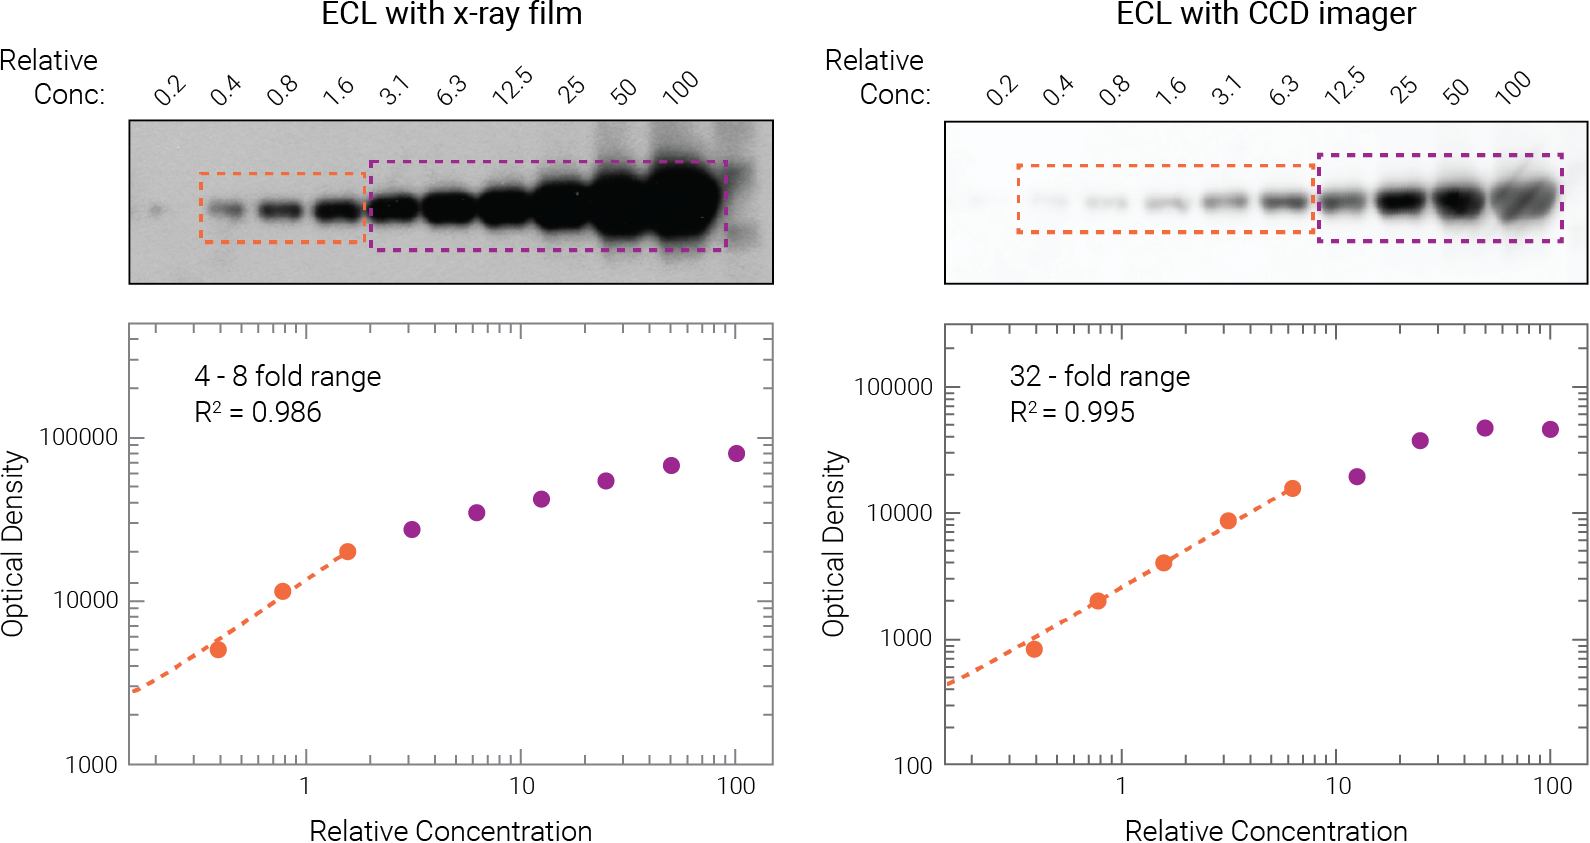
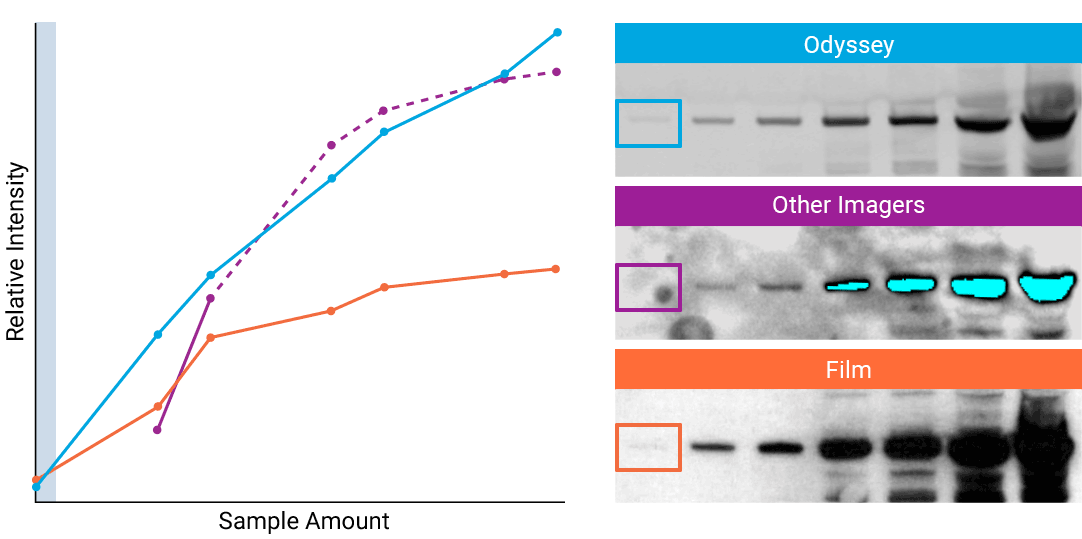
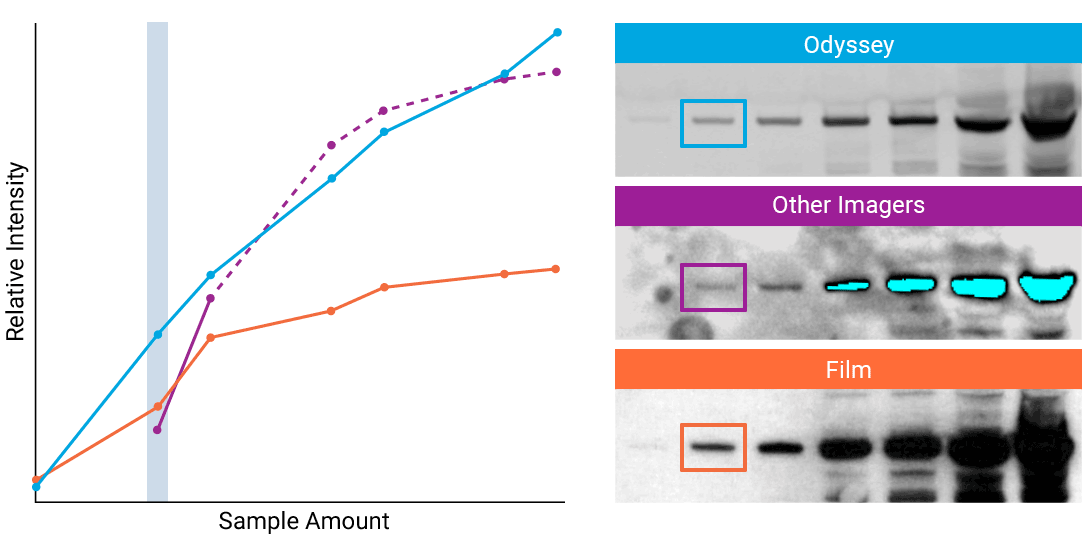
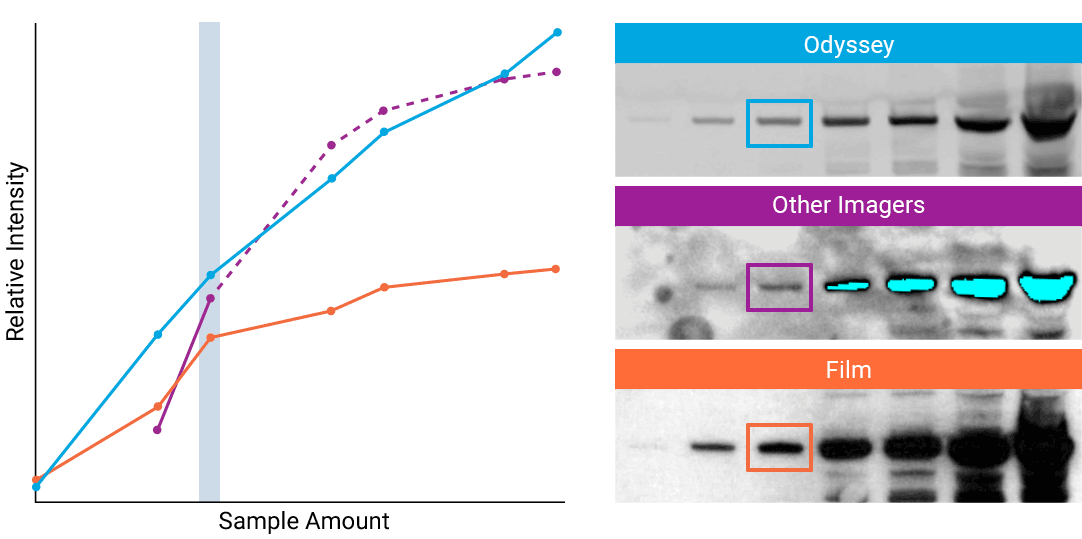
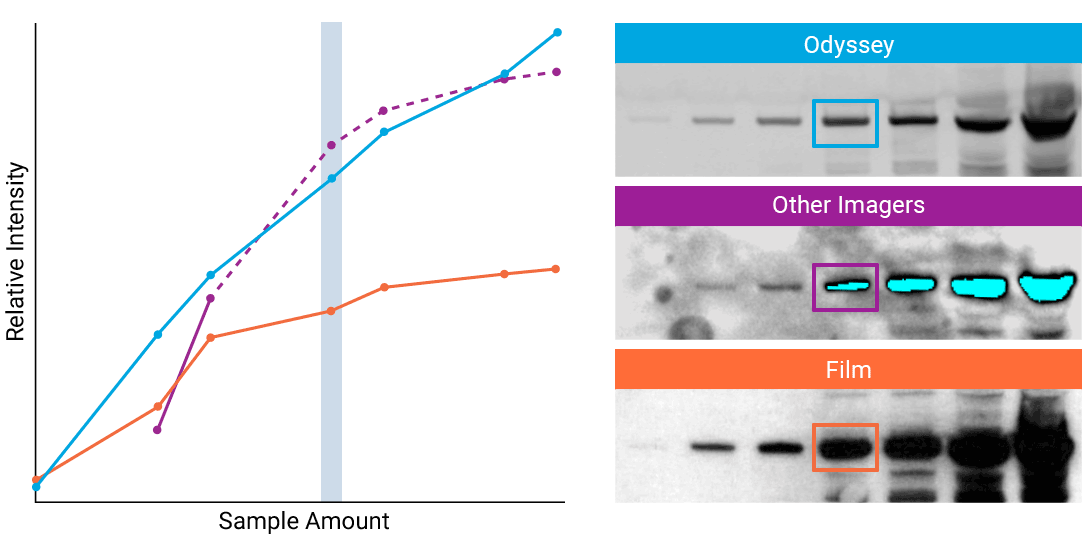
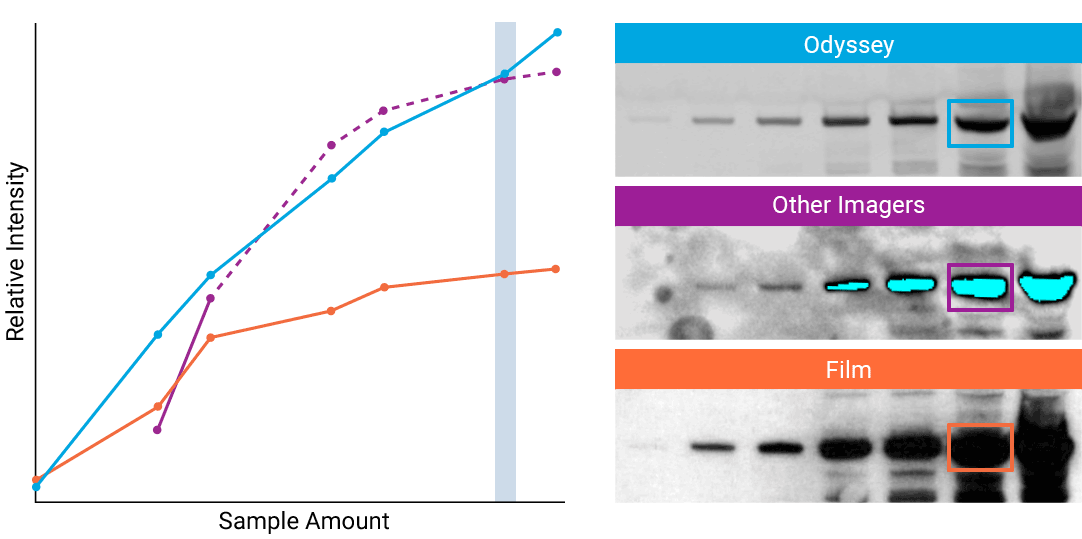
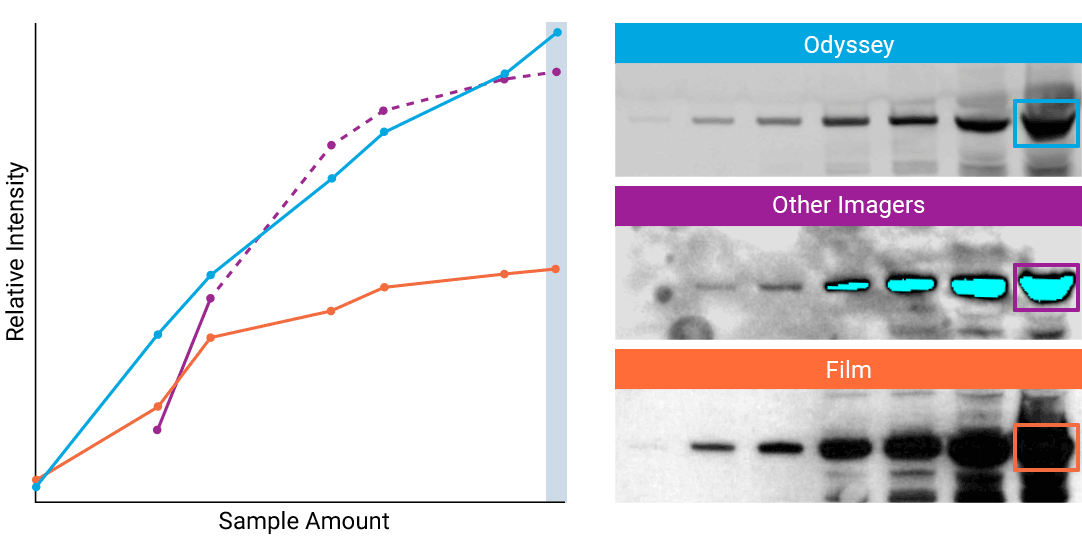
Figure 2. ECL signals quickly become saturated on film and may even saturate on CCD imagers. Two-fold serial dilutions of target protein were detected on replicate Western blots, using ECL substrate.
Film exposure: Only the first 2-3 dilutions (orange) fell with the linear range (4-8 fold range, R2 = 0.986). All other dilutions were affected by saturation (purple).
CCD imager: The linear range spanned only 5 dilutions, a 32-fold range (orange; R2 = 0.995). All other dilutions were affected by saturation. Degasperi et al. PLoS ONE (2014) doi:10.1371/journal.pone.0087293.10
To detect strong signals accurately, the dynamic range of your detection system should exceed both the chemistry and biology of your samples. With a wide dynamic and linear range, your detection system is no longer a limiting factor for generating quantitative data. Odyssey® imaging systems exceed a sample’s ability to saturate the detectors.

“The saturation point of signal is of critical importance when measuring subtle differences in expression levels and can lead to inaccurate measurements.”
Sensitivity can be defined as the lower limit of detection. Choosing a detection system with increased sensitivity extends the lower limit of linear dynamic range. Reducing background with an appropriate blocker also increases sensitivity. For example, a blocking buffer optimization kit can help you identify the best blocking choice for your targets.
The weakest bands on any Western blot may be outside the linear range, so be cautious about comparing or quantitating very weak bands. Depending on your detection system, a good rule of thumb to follow is two standard deviations above the limit of detection. That baseline should provide enough separation over and above any noise resulting from the blot background.
Reduced backgroundcauses higher sensitivity
“Infrared imaging is equally sensitive to chemiluminescence and more sensitive to visible fluorescence in part to reduced autofluorescence in the longer infrared wavelength.”
Since chemiluminescence relies on enzymatic amplification of signal, it can be considered a sensitive detection method. However, chemiluminescence on film is disproportionately insensitive to signal at low intensities of light, because more than one photon of light is required to activate a single silver grain in the film emulsion. This means that film underestimates faint or weak signals, preventing accurate protein quantification.
“…chemiluminescent exposures consistently yielded stronger band densities. However, the linear dynamic range was very limited, and signals often decreased at high protein inputs.”
Visible fluorescence is limited by high background from plastics, membranes, and biological materials. Cellular proteins autofluoresce strongly in visible fluorescence channels (blue, green, and red). Both nitrocellulose and PVDF membranes also strongly autofluoresce in the 532 nm and 635 nm regions. As a result, sensitivity with visible fluorescence detection is severely limiting.

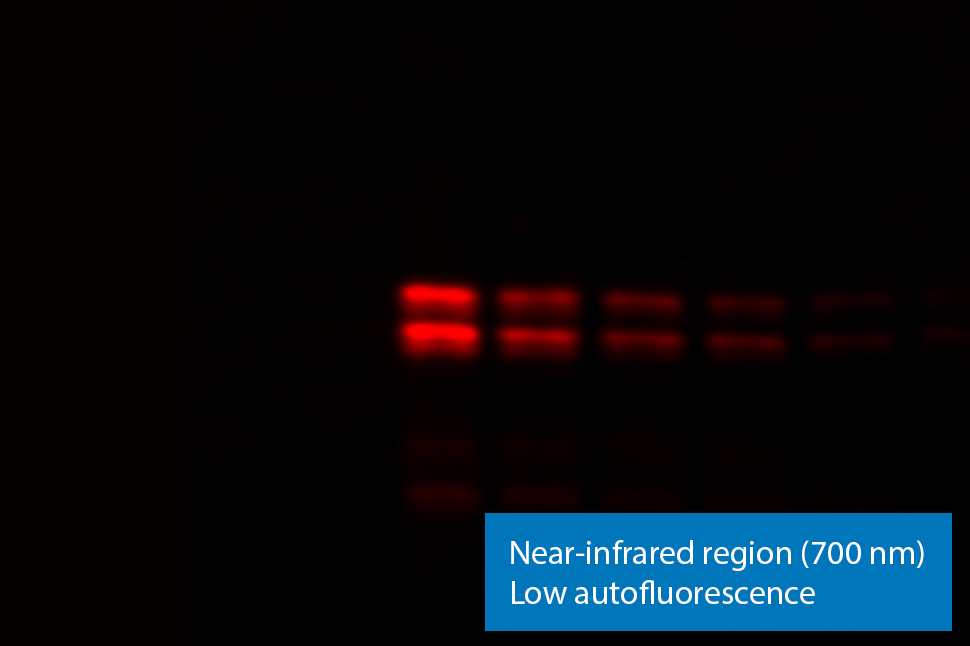
Figure 3. NIR fluorescence imaging gives you low membrane fluorescence and high sensitivity. Visible fluorescent dyes like Cy3 have poor sensitivity, because membrane autofluorescence is so strong. Blots show detection of phospho-ERK with NIR fluorescence (700 nm) and with ECL Plex reagents.
With near-infrared (NIR) fluorescence detection, membrane and protein autofluorescence is negligible. This means high sensitivity in both the 700 nm and 800 nm channels of near-infrared fluorescence detection. By using these wavelengths, fluorescent Western blotting sensitivity can match, or even exceed, ECL sensitivity.
Some instruments use precise laser excitation along with specialized optics to further enhance sensitivity. Lasers eliminate artificial background, by decreasing the light leakage caused by non-specific, diffuse white light. Using NIR lasers results in higher signal-to-noise ratios and better image quality.
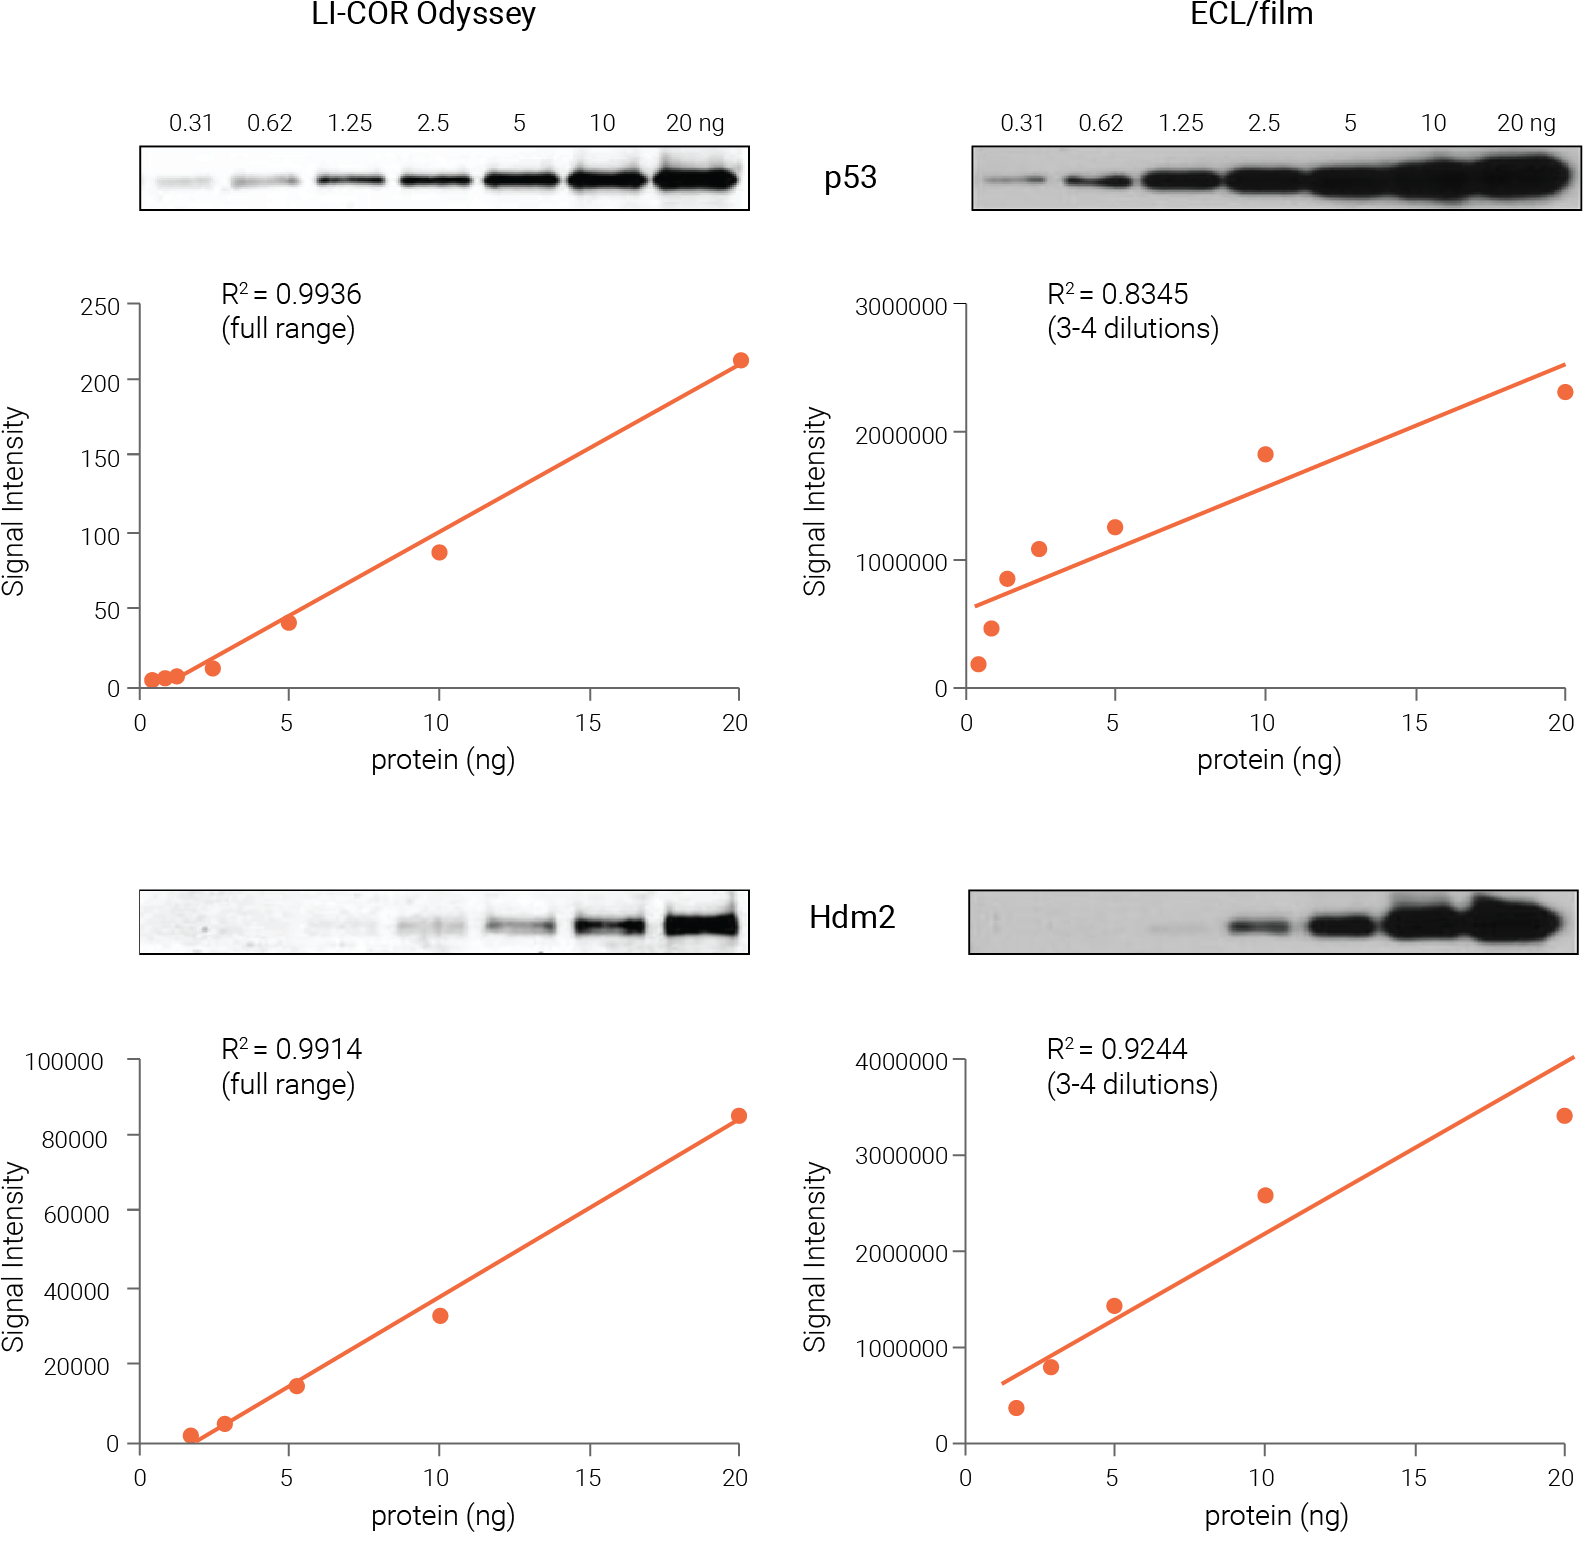
Figure 4. Odyssey Western blot data are linear and quantitative across a much wider range than ECL and film. Pure recombinant p53 and Hdm2 proteins of known concentration were serially diluted for Western blot analysis. Proteins were detected with NIR fluorescence (Odyssey Imager) or ECL and film. NIR signals were linear across the entire range tested, with R2 > 0.99 for both targets. In contrast, ECL signals were linear across only a narrow range of 3-4 dilutions (4-8 fold), with R2 = 0.83 and 0.92, respectively. Wang et al (2007) Proc Natl Acad Sci USA. 104(30): 12365-70. Copyright (2007) National Academy of Sciences, U.S.A.
“Furthermore, membranes and biomolecules show little autofluorescence in the longer NIR wavelength region, dramatically lowering background and significantly increasing the associated signal-to-noise ratio.”
“…it is our experience and opinion that each immunoblot should contain a demonstration of the linearity of the detection system.”
LI-COR provides products, protocols, and support for Western blotting (and a range of other assays) that help reduce variability and increase replicability. Let us know how we can help you.
Get in TouchContinue reading: Normalizing to Correct for Technique Variability