Even with consistent sample loading and accurate normalization, replication is still necessary. Replication helps you discern if a difference in relative quantitation is due to a real change in protein expression, or perhaps a small difference in Western blotting technique.
Both biological and technical replicates are necessary for accurate, reliable results. Technical replicates will help you identify inaccuracies caused by processing variation, while biological replicates will help confirm that biological changes are real and not a fluke.
“Information including but not limited to the number of repetitions, cells, or samples analyzed must be provided in the relevant figure legend(s) and/or Materials and methods section.
Technical replicate: repeated measurements of the same sample that represent independent measures of the random noise associated with protocols or equipment.2
Technical replicates address the replicability of the assay or technique, but not the replicability of the effect or event being studied. But technical replicates can be very important – they tell us if our measurements are scientifically robust or noisy, and how large the measured effect must be to stand out above that noise.
Biological replicate: parallel measurements of biologically distinct samples that capture random biological variation, which may itself be a subject of study or a source of noise.2
Context is critical, and appropriate replication may depend on how widely the results can be generalized. If it’s possible, demonstrate the effect you’re studying in multiple samples and cell types.
“Ideally, researchers at the bench should be able to identify whether a failure to reproduce published data in their laboratories is based on a valid difference in experimental findings or on the result of changes in production or distribution of research tools. To ensure reproducibility, the reporting of research reagents must be complete and unambiguous.”
Some choices researchers make are objective (based on data). Others are more subjective and stem more from personal preference. It’s important to be aware of decisions that other researchers may make differently.
For example, Western blotting may encompass a range of experience levels: from undergrads to PIs. A perfectly designed protocol doesn’t help your replication efforts if you don’t follow it.
“An investigation of quantitative western blotting using erythropoietin showed that the interoperator variability was the main error source, accounting for nearly 80% of the total variance.”
Even with a validated and appropriate loading control, normalization can’t correct for all sources of error in Western blot technique. Make sure to check that your sample prep, loading, and transfer Western blotting procedures are as free of variability as possible.
Variability in your samples can arise from:
Develop a consistent protocol for preparing samples. Then make sure you (and the rest of your lab) follow it as best as you can.
“The conditions of cell lysis have a profound impact on the proteins that are extracted and the condition in which they are preserved.”
Air bubbles, variable amounts of sample loading, and similar errors can happen without careful attention to proper pipetting technique. Inconsistent sample loading cannot be avoided entirely, which is why normalization is so important.
Use a BCA assay (also called “bicinchoninic acid assay” or “Smith assay”) or a Bradford assay to determine the concentration of a protein in solution. A concentration assay, along with a dilution series, will help you determine an appropriate amount of sample to load.
Use a concentration assayto load the right amount of sample
“In our experience, differences due to position on the gel and improper mixing of samples can be more significant than potential loading effects (as long as a BCA test is run first). Therefore it is most important that samples be positioned randomly on the gel, and gels run at least in duplicate (we prefer triplicate).”
Replicates are also important for spotting variation that may be caused by transfer. The transfer process introduces many possible sources of variation:
“One problem that may be encountered is variations in transfer efficiency. Small proteins (<10 kDa) may not be retained by the membrane, large proteins (>140 kDa) may not be transferred to the membrane and varying gel concentrations may affect transfer efficiency.”
Chemistry can be tricky to replicate. In an enzymatic reaction (like chemiluminescence), timing greatly affects signal intensity. Consider these sources of variability with ECL:
“Appropriate blocking reagents must be selected to avoid high background and nonspecific binding. Under certain blocking conditions, as much as 60% of proteins have been shown to be lost from membranes.”
Some antibodies perform differently depending on their application or assay. It’s important to optimize the amount of antibody to get signals proportional to your targets.
Using too much secondary antibody can cause non-specific binding. One form of non-specific binding is secondary antibody cross-reactivity, which is when the secondary antibody reacts directly with proteins in the sample, or the wrong primary antibody, instead of the intended primary antibody. To get the best results, check for non-specific binding. Ensure that the intended antibody specifically binds to the correct target.
“With limited research funding, identifying poor quality antibodies and poor Western blotting techniques will save money, save researchers time and improve the quality of the results.”
Substrate availability affects signal intensity. The amount of substrate available to the HRP enzyme may be variable across the blot, which changes the rate of the enzymatic reaction.
Variable substrate availability in different areas of the blot causes inconsistent signal generation. Factors to watch out for include substrate pooling, bubbles, and non-uniform distribution of substrate, because each can affect signal intensity.
Local depletion is when a high antibody concentration causes higher enzymatic activity in localized areas. It can be avoided by ensuring substrate is in excess, as well as optimizing both primary and secondary antibody concentrations.
It’s best to apply substrate equally across the blot, following vendor recommendations for volume of substrate per cm2 of membrane. Ignoring supplier recommendations, or applying substrate inconsistently to certain areas to save money can result in substrate depletion. In the case of applying “just enough” substrate, the reaction can quickly be over. Once that happens, even substrate diffusion from an adjacent area may not be able to replenish substrate in that depleted area. The amount of substrate becomes the limiting factor on the reaction, instead of the amount of HRP enzyme (secondary antibody). If you’re skimping on substrate to save a buck, that can create additional issues by limiting the enzymatic reaction.
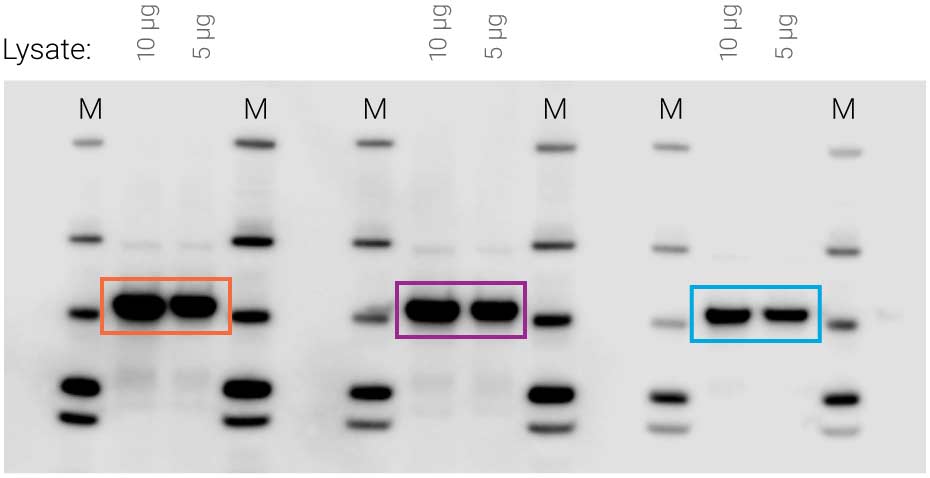
Figure 1. Availability of substrate affects signal intensity. Identical samples were loaded three times on the same blot (10 μg and 5 μg cell lysate). SuperSignal West Pico substrate was applied to the blot, followed by 5-minute film exposure. Non-uniform substrate distribution made some signals much stronger than others (compare orange to purple and blue).
“Addition of too much secondary antibody enzyme conjugate and/or incubation of the secondary enzyme for prolonged periods are major causes of high background, short signal duration, signal variability and low sensitivity.”
Timing matters. Keep these timing factors identical between replicates:
There’s also a limited window for detection. When the HRP enzyme has consumed all the substrate, the signal (light) fades, and your opportunity for using that blot is over. Signal fades in minutes with ECL. The answer you get depends on when you ask. Because signals are unstable, your results are dependent on timing. ECL will give you different results when you measure at different times.
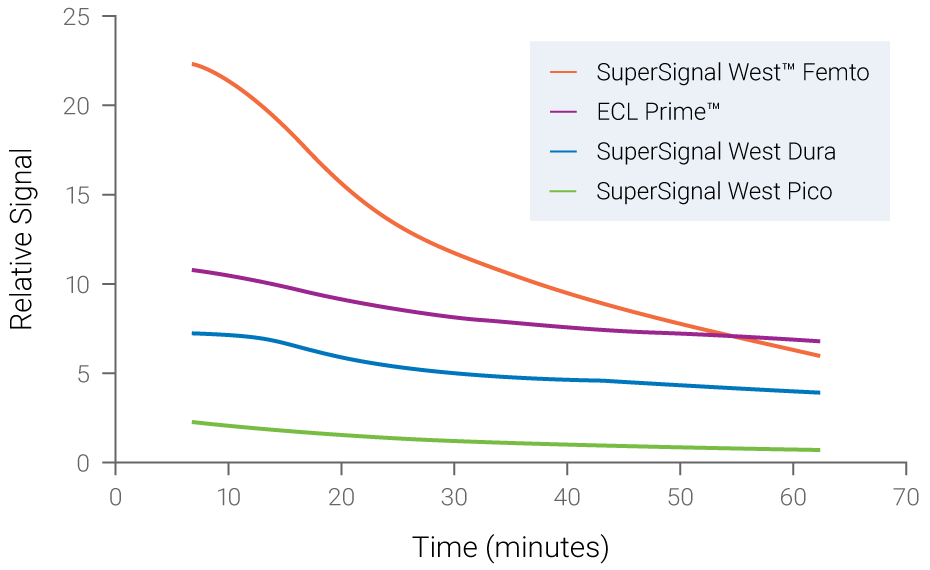
Figure 2. Chemiluminescent signals are unstable and time-dependent. Signal instability of various chemiluminescent substrates was measured over time. Fading of signals was observed for all substrates, with SuperSignal West Femto displaying the most rapid loss of signal.
When using ECL for your detection chemistry, a runaway reaction creates a lack of proportionality. ECL signals may not be proportional to the amount of protein, due to the enzymatic amplification of signal.
Since ECL is an indirect method (the signal detected is light emitted from the HRP reacting with substrate), enzyme and substrate kinetics can really affect quantitation. The alternative is to use a direct method like fluorescence, because dyes labeling the secondary antibodies are the only signals detected.
Using IRDye fluorophores, signals are stable for months. Timing is no longer such a critical part of the experiment. All of the variables associated with enzyme kinetics or substrate availability are eliminated.
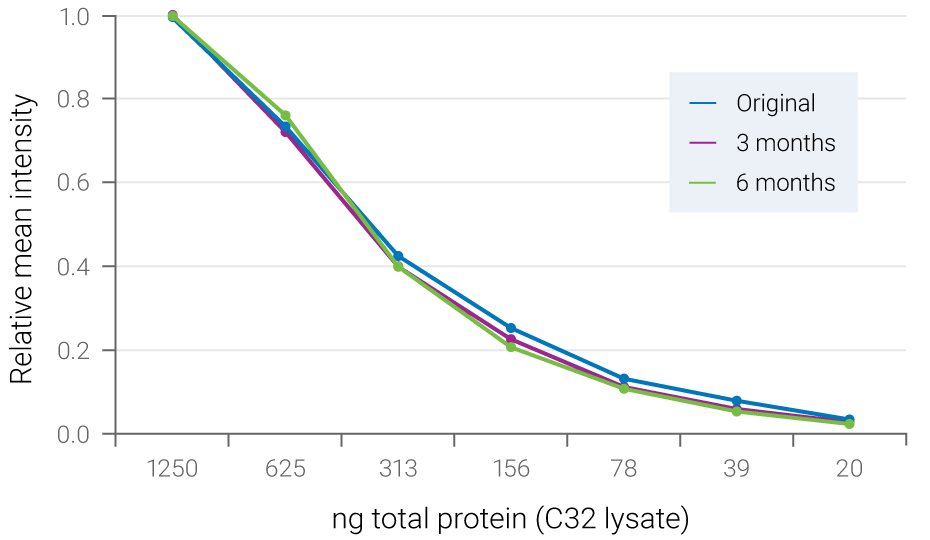
Figure 3. Fluorescent signals are stable for months. Serial dilutions of C32 cell lysate were blotted to PVDF membrane and ERK2 was detected with NIR fluorescence. The blot was stored dry at 4° C and re-scanned at 3 months and 6 months. Relative mean intensity of fluorescent signals was maintained during storage.
“Fluorescent secondary antibodies detected in the infrared spectrum produce a constant amount of light. The static nature of the intensity of light generated by infrared activation improves precision and the ability to differentiate differences in signal intensity produced by antibodies bound to proteins. This allows for a more accurate quantification of protein levels compared with enzyme-labeled secondary antibodies.”
There are two types of imaging variability; the kinds of decisions the manufacturer makes (for example, the way the instrument software captures data and stores it), in addition to any decisions the researcher makes. For instance, some researchers may use the same instrument in completely different ways, due to differences in training, experience, or simply personal preference.
What kinds of decisions do instrument manufacturers consider? The instrument software is one area where vendors typically differ. Keep in mind that different imagers will get completely different data from the same blot, due to differences in how data are captured.
Automatic settingsremove human bias
For the best ECL data, what you don’t want is a variety of subpar image captures with completely variable raw data associated with each one. Then your decision is simply settling – which of these images is the least awful? Rather, a single image with one set of raw data, capturing the full breadth of bands from a wide linear dynamic range, will be the most useful for protein quantification and comparison.
The Autoscan feature of the Odyssey® DLx imager is designed for getting the right image the first time. The result is one image with both faint (low-intensity) and strong (high-intensity) bands visible and ready for quantitative analysis. That requires an imager that can get high sensitivity without saturation.
“Additionally, the available image analysis software has transformed the once frustrating western blotting of yester years to that which can be imaged accurately and repeatedly with a one-touch, preset or user-defined setting.”
Imagers that lack this wide dynamic range use other techniques to artificially get passable results. For example, binning sacrifices image resolution to compensate for low sensitivity. Signals from surrounding areas are combined into one data point. Importantly, pixel values are reassigned. This gives you a fuzzy image and can affect accurate quantitation.
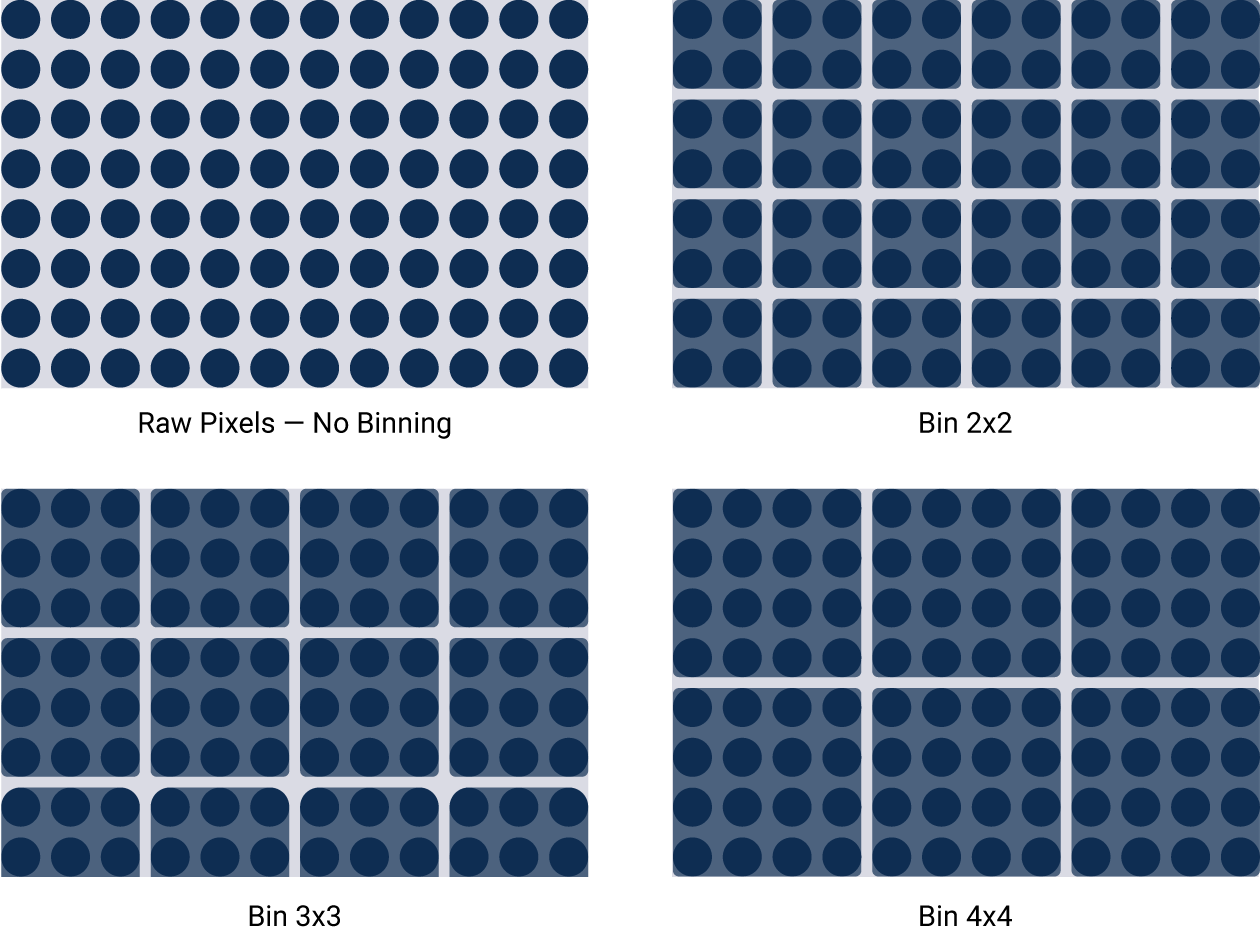
Figure 4. Binning artificially improves sensitivity, but sacrifices image resolution. Binning is a software algorithm applied post-capture. It combines groups of pixels to effectively create larger pixels. This results in an image with improved sensitivity, but reduced image resolution.
With proper optical design, image capture should be uniform across the entire blot. The entire field of view will ideally have a very low coefficient of variation. When instruments aren’t designed with the best performance in mind, blots may be altered post-capture to adjust for the non-uniform image with flat fielding. Flat fielding is a fix for subpar capture, rather than a real solution.
In any case, an instrument designed for the best image capture possible will require fewer decisions on the part of us mere mortals. The definition of being human is that we mess things up. So where proper instrument development and design has taken place, the only choices left will be those that are dependent on your specific research needs. For example, running a microwell plate instead of a blot on the same scanner. A powerful imager will capture great data the first time, without making you endlessly ponder and control for numerous variables.

Figure 5. Flat fielding is a post-capture method to correct for non-uniform illumination. Flat fielding is not necessary with proper optical design; image capture should be uniform across the entire blot.
As with image capture, Western blot analysis that reduces variability wherever possible is the goal. Journals often discourage altering image appearance too much, and outright ban doctoring images by removing artifacts or unwanted bands. Be wise when changing the brightness or contrast of your blots, and always avoid changing the raw data.
With an imager, your results are already digital and immediately ready for analysis. With film, you need to digitize your results. Once you’ve got a decent film exposure or two, the data concerns don’t stop there – especially considering that the tools available to digitize data aren’t always designed with scientific rigor in mind.
Ever notice how a copy of a copy of a copy makes for a lousy office memo? That’s because office scanners aren’t built for high fidelity capture – they’re built for an office. A dedicated laboratory scanner is designed to capture data in a scientific setting. An office scanner is not, and the differences in design reflect that. For instance, a common office copier has limited dynamic range and uneven illumination of the scan area.
In addition, an automatic gain control can significantly affect the signal in one area due to differences in surrounding areas. A quantitative Western blotting procedure should measure all signals independently – regardless if the rest of the blot has a lot of noise or signal, or not.
“Linear adjustment of contrast, brightness, or color must be applied to an entire image or plate equally. Nonlinear adjustments must be specified in the figure legend. Selective enhancement or alteration of one part of an image in not acceptable.”
“…additional image corrections that could alter the linearity, such as automatic gain control.”
Densitometry measures the degree of darkness of the film image, as a function of light transmission through the developed film. For example, if a region transmits one-tenth of the incident light, its density is equal to 1. For Western blot analysis, the useful range of densities is approximately 0.2 - 2.0 (roughly 10-fold). This range represents the shades of grey that can be discriminated by densitometry. Higher optical densities (ODs) (above 2.0) appear black and indicate saturation.
The overall response of film is non-linear, but approaches linearity over narrow ranges. A standard curve can help confirm the linear range of film response for each experiment.
Prepare a Western blot image for publication with analysis software:
To quantify Westerns accurately, you need to use a method of background subtraction. The best method for background correction depends on your image and its background consistency. Empiria Studio® Software automatically subtracts background using the patent-pending Adaptive Background Subtraction to eliminate user-to-user bias and reduce variability.
“…a larger disc size than necessary leads to only partial removal of the background while a smaller disc size than needed will result in the deletion of the actual target protein signal.”
The Rolling ball method from ImageJ software subtracts background from an entire image, which will modify the underlying image data. It also requires you to select a radius for your Rolling ball correction. The correct radius depends on image resolution, shape width, shape separation, and shape overlap – which can all vary throughout an image. Selecting a radius that allows for consistent, accurate background subtraction can be difficult.
Image adjustments in Empiria Studio Software change only how the image is displayed, but never the raw data.
Empiria Studio Software has been specifically designed for Western blot quantification and statistical analysis. It makes analyzing replicates blots quick and simple, then presents your results in scatterplots and automatically calculates values such as standard deviation and coefficient of variation.
“…programs containing rolling ball algorithms that are applied to the entire image for immunoblots such as found in ImageJ should be avoided.”
You can reduce variability in many ways. Here are some Western blot tips for more accurate and replicable data.
LI-COR provides products, protocols, and support for Western blotting (and a range of other assays) that help reduce variability and increase replicability. Let us know how we can help you.
Get in Touch