Example In-Cell Western Assay Development Project
Defining the Experimental System
These are some key components for the target assay. The target assay is further developed in the experiments in this section.
Model system
Target proteins: Total ERK1 and phosphorylated ERK1/2
Cells: HeLa cells (adherent cell line)
To stimulate ERK1/2 phosphorylation: TPA
To inhibit phosphorylation: U0126
Plate Format: Black-sided with clear well bottoms are needed.
Plates used for this assay: Greiner Bio-One 96-Well µCLEAR® Plate, LICORbio PN 926‑19156 (8 pack) or 926‑19157 (32 pack)
Normalization method: CellTag™ 520 Stain (PN 926-41094)
Imaging system: (licor.com/bio/odyssey-m)
Choosing a Normalization Method and Determining Linearity
Cell Stain Linearity | In‑Cell Western Assay | pan-ERK1
The goal of this experiment is to determine the linear range of detection for the CellTag™ 520 Stain normalization method in the context of the target assay. The appropriate cell number should be within the linear range of detection and result in cells that are about 70 to 80 percent confluent at the time of detection.
CellTag 520 Stain has a broad linear range in this assay. In this assay, seeding 10,000 cells/well results in CellTag 520 signal that is within the linear range and results in cells that are approximately 80% confluent at the time of imaging. Comparable results were found for CellTag 700 Stain (data not shown). Using CellTag 520 Stain in the target In‑Cell Western Assay enabled simultaneous detection of pan-ERK1 in the 700 channel and p-ERK1/2 in the 800 channel.
Key finding: Seeding about 10,000 cells/well is an appropriate starting point for the assay being developed (Figure 122).
Experimental Details
Fixation/Permeabilization: 3.7% Formaldehyde + 0.2% Tween® 20
Blocking Buffer: Intercept® (PBS) Blocking Buffer (PN 927-70001)
Cells: HeLa Wild Type (WT) and HeLa ERK1 Knockout (KO1)
Acquisition Software: LI‑COR® Acquisition Software
Analysis software: Empiria Studio® Software with the [Preset] Cell Stain Linearity Plate Template
Imaging system: Odyssey M Imager
Results

Validating Antibodies
The goal of the antibody validation experiments in this section is to ensure that chosen antibodies will work as needed in the target assay.
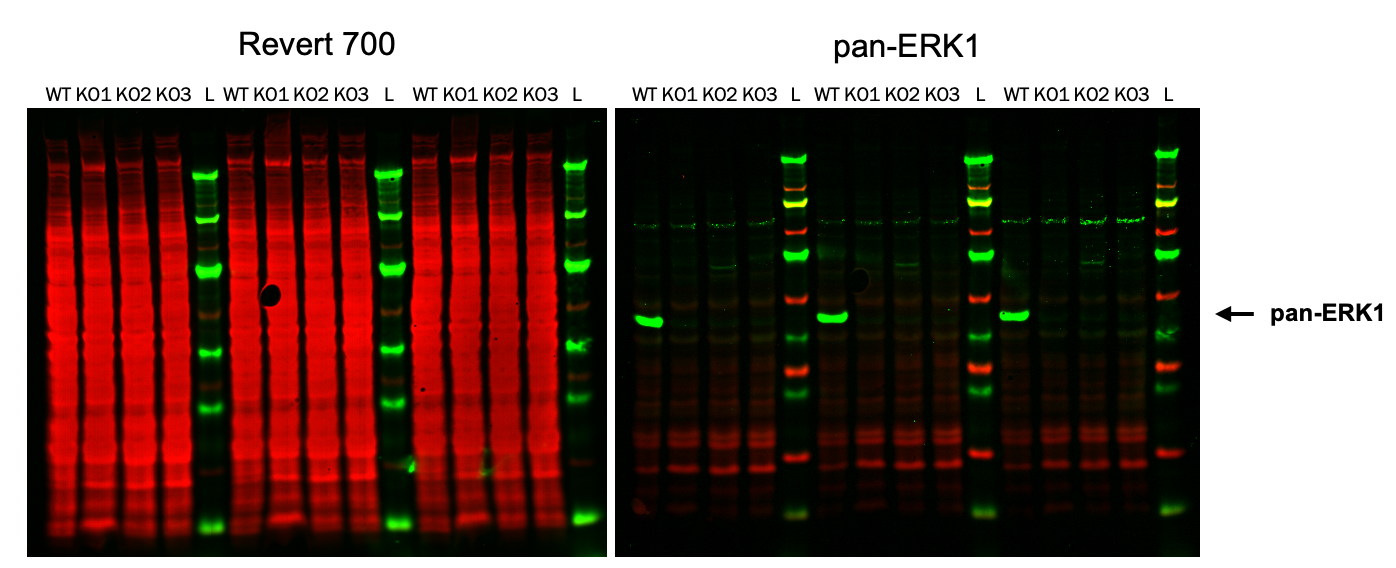
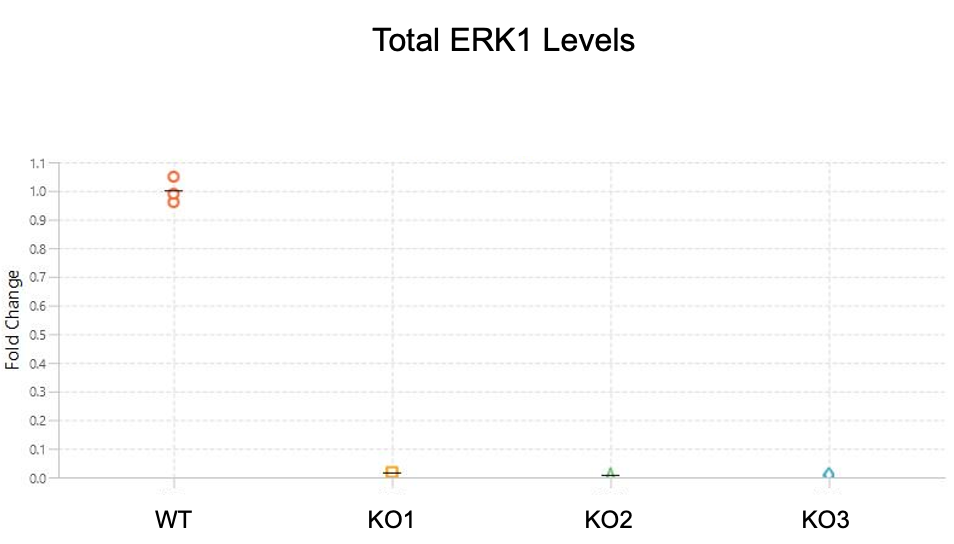
Antibody Validation | Western Blot | pan-ERK1
In this experiment, a primary antibody was evaluated in positive controls (HeLa WT cells) and negative controls (three stable clonal isolates of HeLa ERK1 KO cells).
Key finding: A single band is present in the positive control, but bands are not present in the negative control, providing evidence that the primary antibody will be specific to the target protein in the target assay (Figure 123).
Experimental Details
Target: pan-ERK1
Secondary Antibody: IRDye® 800CW Goat anti-Mouse IgG (926-32210)
Normalization method: Revert™ 700 Total Protein Stain (PN 926-11011)
Blocking buffer: Intercept® (PBS) Blocking Buffer (PN 927-70001)
Samples: HeLa whole cell lysates
Cells: WT and three stable ERK1 KO lines (knockout accomplished with SantaCruz CRISPR/Cas9 system)
Analysis Software: Empiria Studio® Software
Acquisition Software: LI‑COR® Acquisition Software
Imaging System: Odyssey M Imager
Results
Antibody Validation | In-Cell Western | pan-ERK1
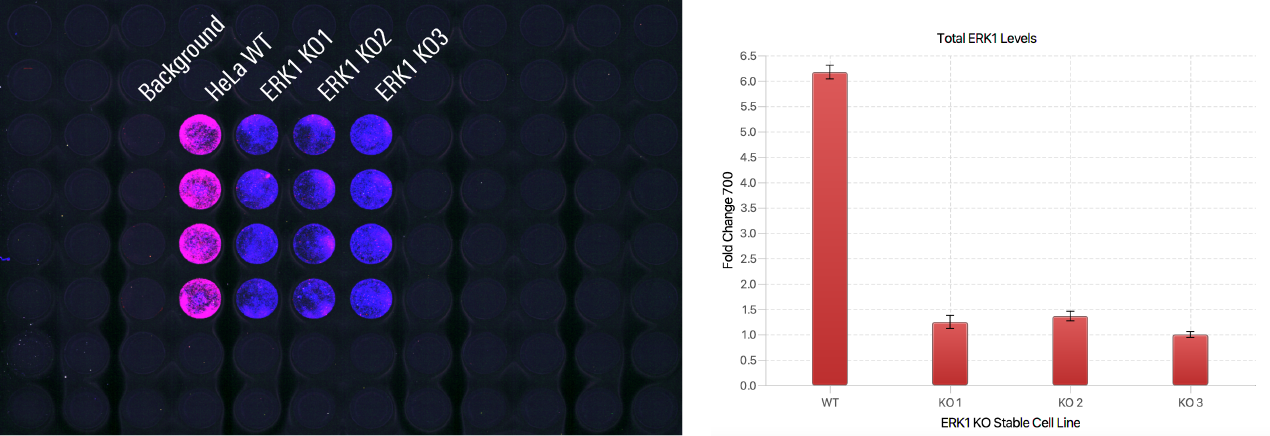
In this experiment, a primary antibody was evaluated in positive controls (HeLa WT cells) and negative controls (three stable clonal isolates of HeLa ERK1 KO cells).
Key finding: Positive controls showed signal but negative controls did not, providing evidence that the primary antibody will be specific to the target protein in the target assay (Figure 124).
Experimental Details
Target: pan-ERK1
Secondary antibody: IRDye® 680RD Goat Anti-Mouse (PN 926-68070)
Normalization method: CellTag™ 520 Stain (PN 926-41094)
Fixation/Permeabilization: 3.7% Formaldehyde and 0.2% Tween® 20
Blocking buffer: Intercept® (PBS) Blocking Buffer (PN 927-70001)
Cells: HeLa WT and three stable HeLa ERK1 KO lines (knockout accomplished with SantaCruz CRISPR/Cas9 system PN)
Analysis Software: Empiria Studio® Software
Acquisition Software: LI‑COR® Acquisition Software
Imaging System: Odyssey M Imager
Results
Choosing Fixation and Permeabilization Conditions
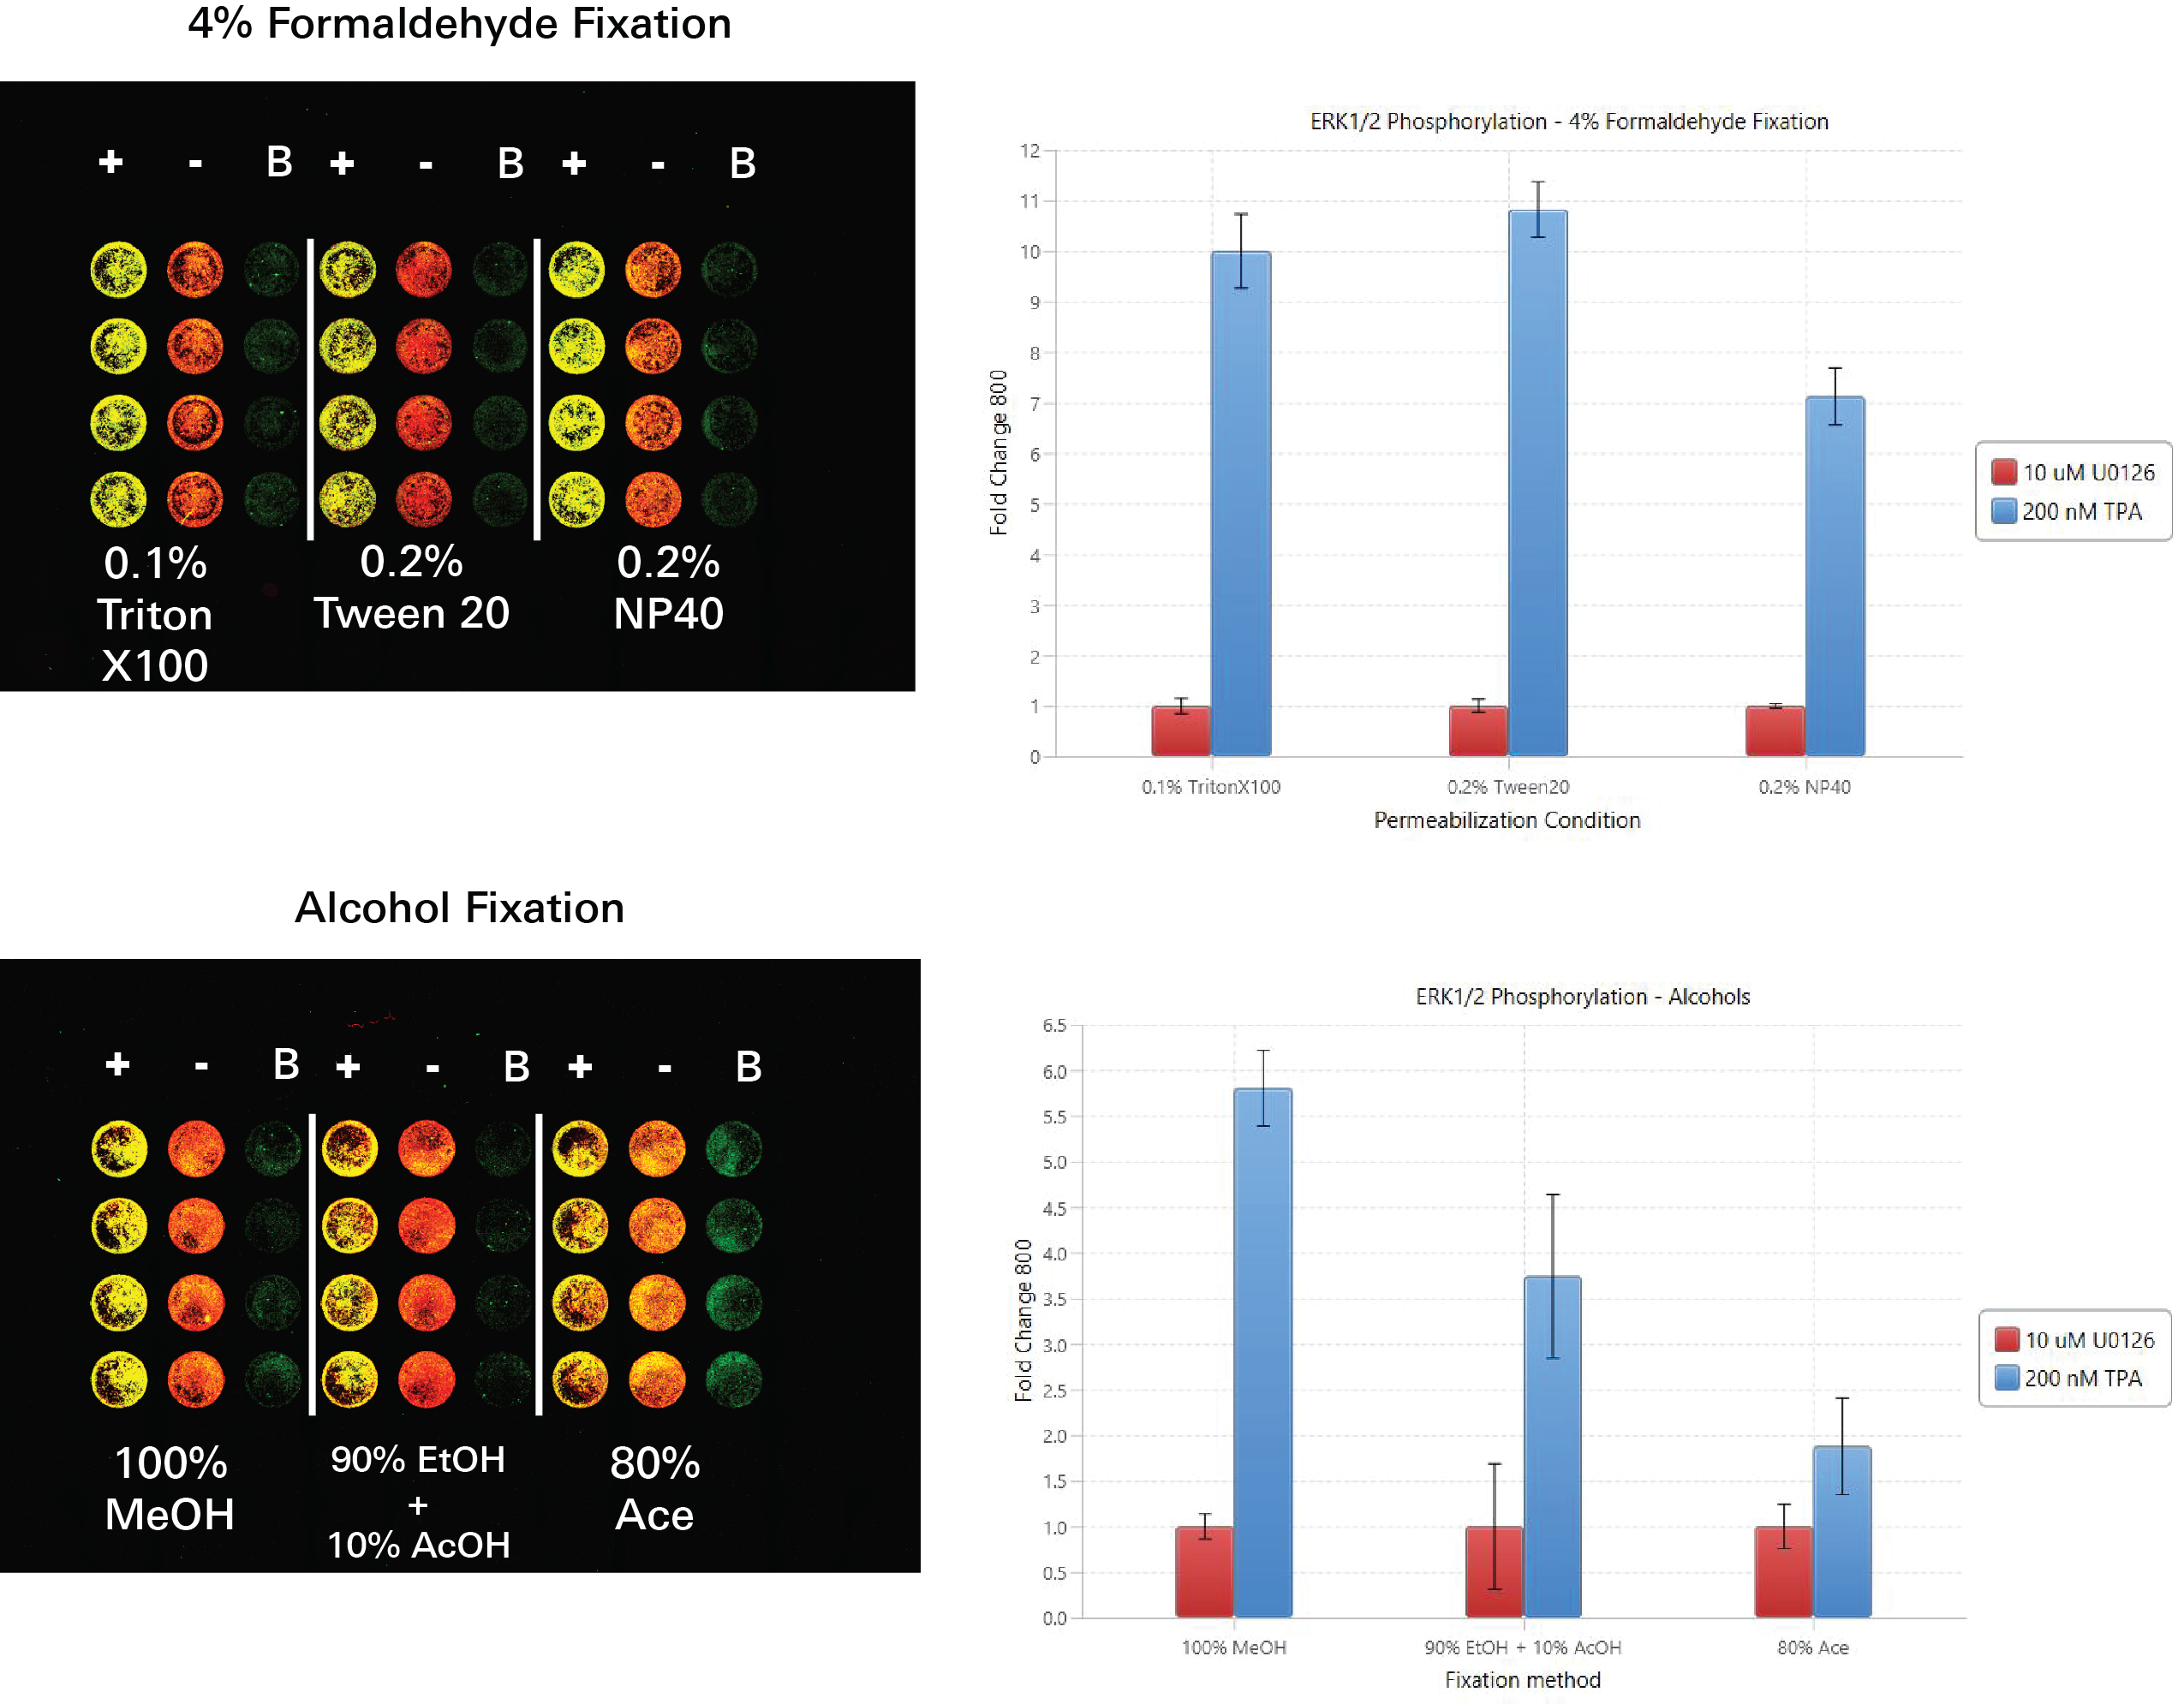
In these experiments, a variety of fixation and permeabilization combinations were evaluated via In‑Cell Western Assays.
Key finding: The same fixation and permeabilization conditions worked well for pan-ERK1 and p-ERK1/2, so those fixation and permeabilization conditions will be used in the target assay.
Fixation and Permeabilization Evaluation | In-Cell Western | pan-ERK1
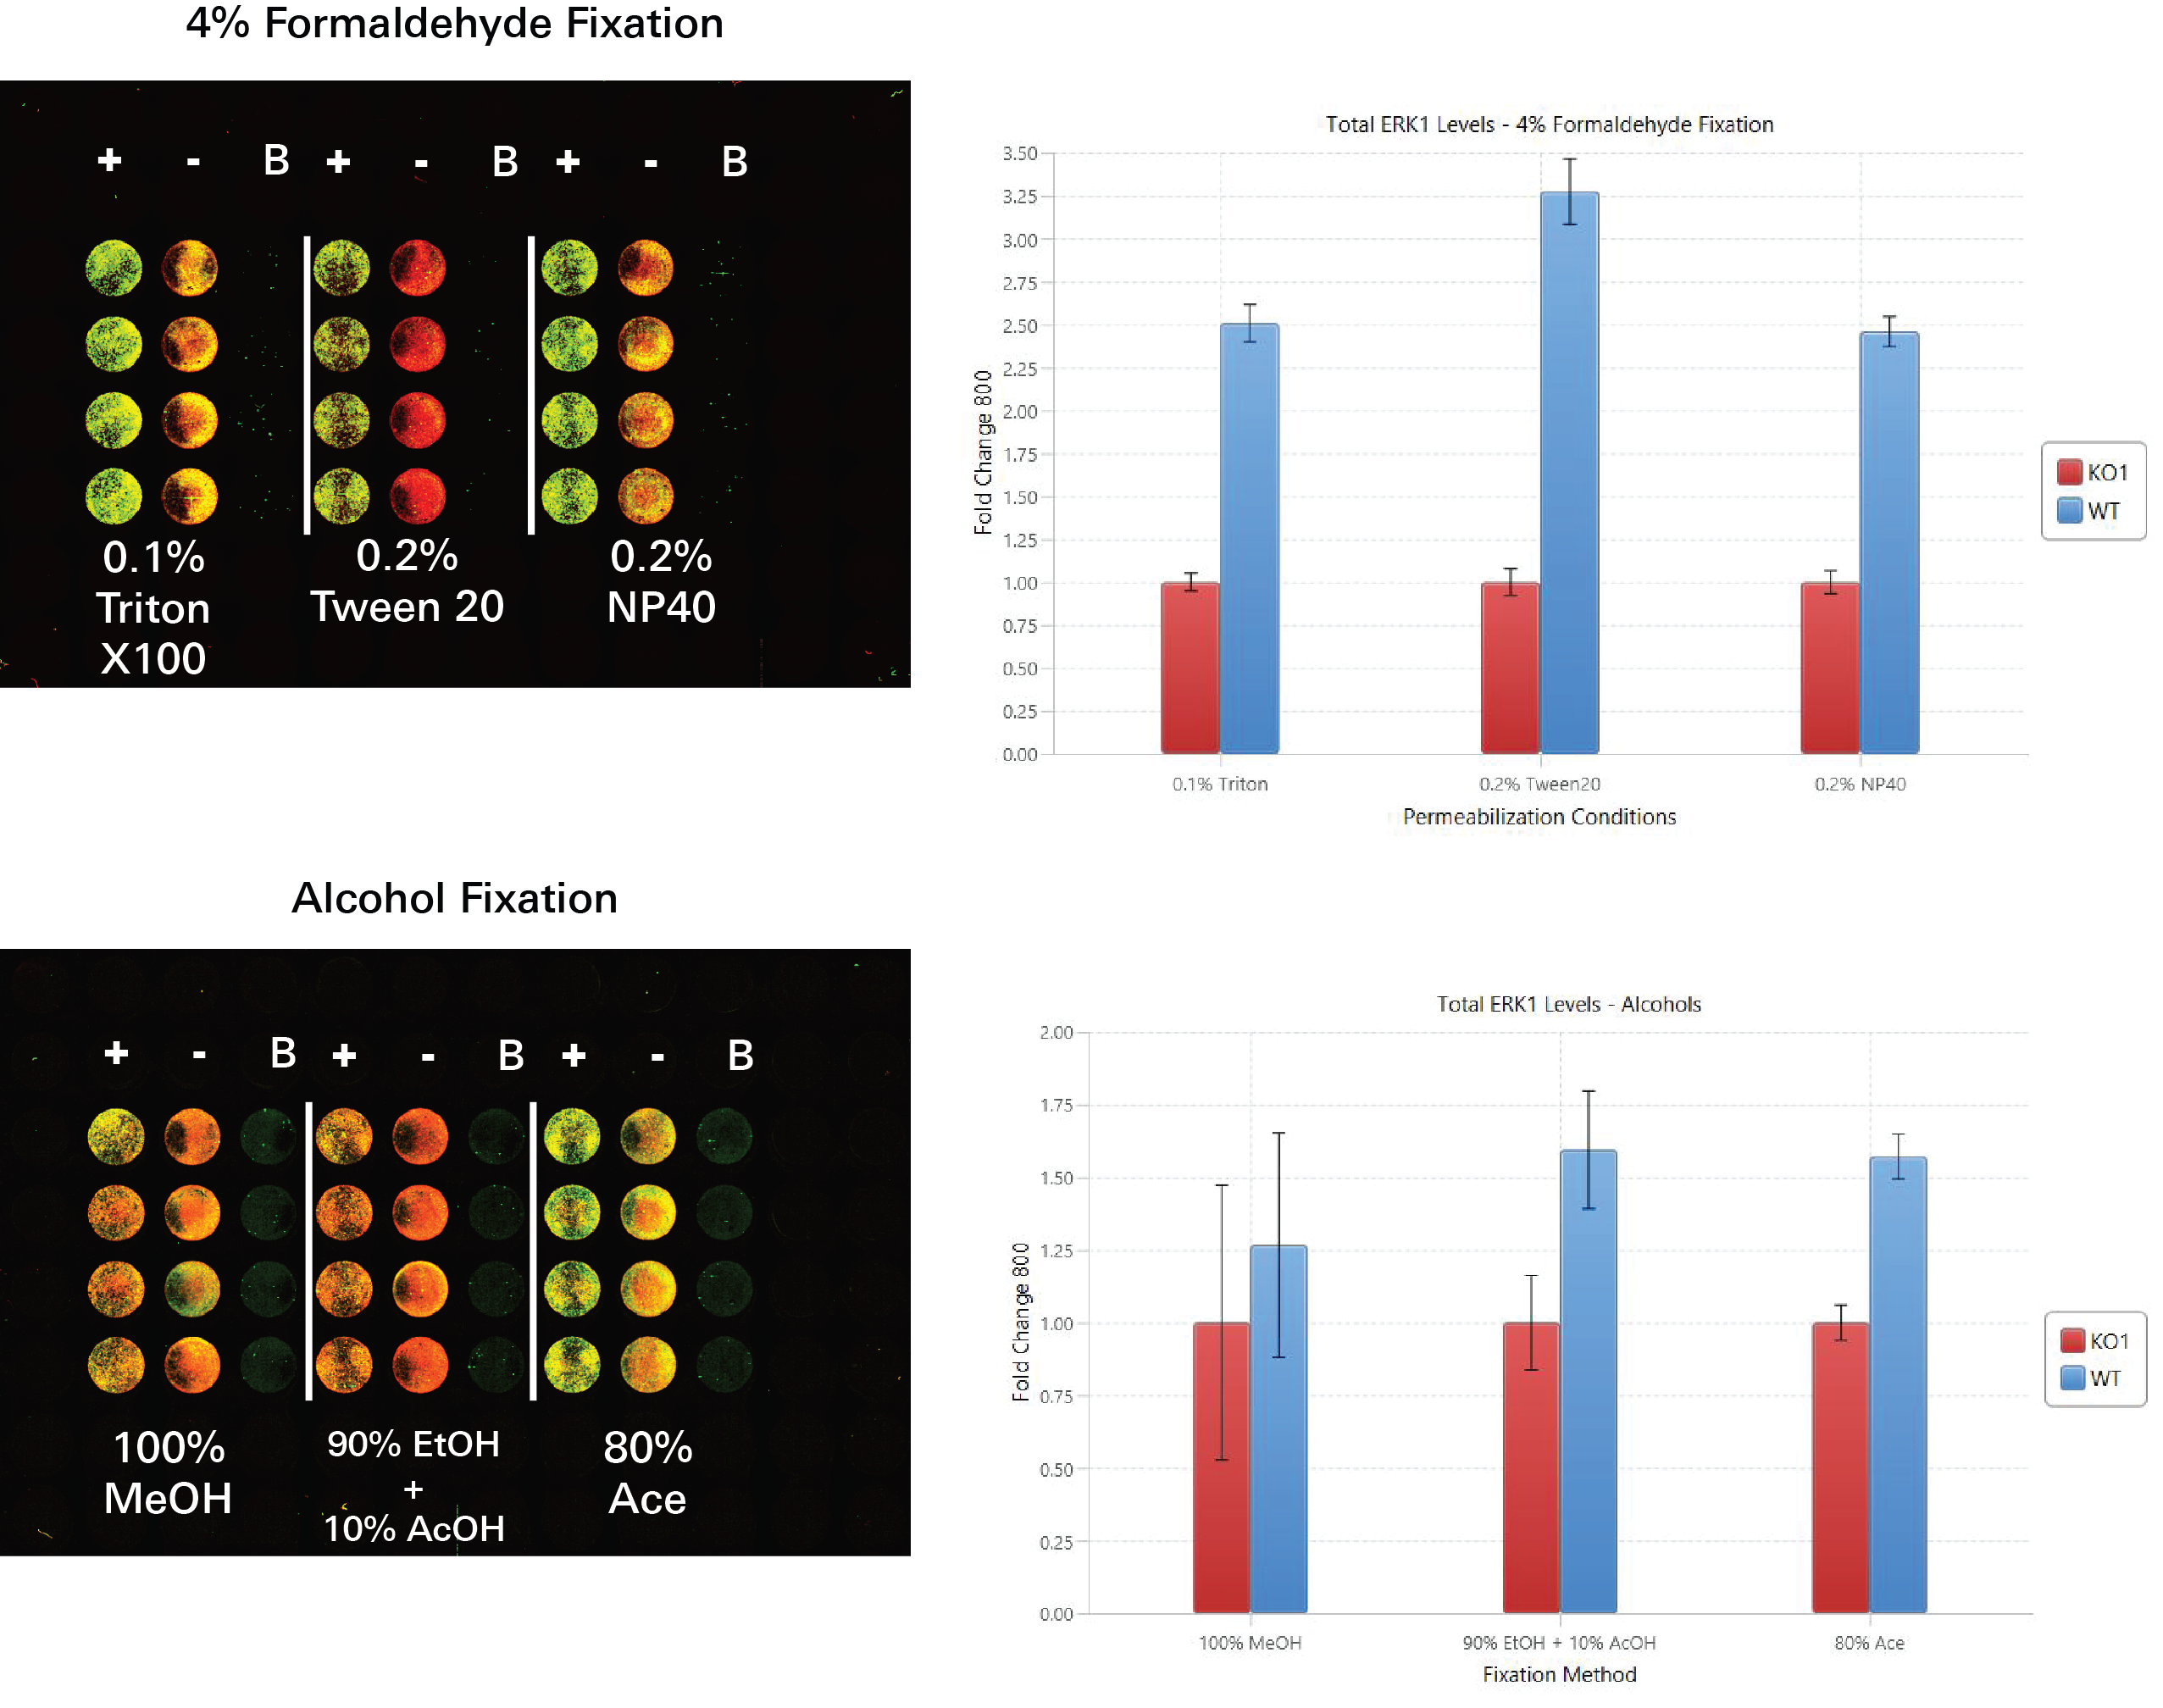
In this experiment, fixation and permeabilization conditions were evaluated by determining the fold change between ERK1 signal detected in positive controls (HeLa WT) and ERK1 signal detected in negative controls (ERK1 KO) within different fixation/permeabilization conditions.
Key finding: Using 0.2% Tween® 20 for permeabilization and 4% formaldehyde for fixation yielded the largest fold change between positive and negative controls, indicating that 0.2% Tween 20 and 4% formaldehyde are acceptable conditions for the target assay (Figure 125).
Experimental Details
Primary antibody: Invitrogen – MA5-15896
Secondary antibody: IRDye® 800CW Goat Anti-Mouse (PN 926-32210)
Normalization method: CellTag™ 700 Stain (PN 926-41090)
Blocking buffer: Intercept® (PBS) Blocking Buffer (PN 927-70001)
Analysis software: Empiria Studio® Software using the [Preset] Fixation and Permeabilization Evaluation Plate Template
Acquisition Software: LI‑COR® Acquisition Software
Imaging system: Odyssey M Imager
Results
Fixation and Permeabilization Evaluation | In-Cell Western | p-ERK1/2
In this experiment, fixation and permeabilization conditions were evaluated by determining the fold change between p-ERK1/2 signal detected in positive controls (TPA treated HeLa WT) and p-ERK1/2 signal detected in negative controls (U0126 treated HeLa WT) within different fixation/permeabilization conditions.
Key finding: Using 0.2% Tween® 20 for permeabilization and 4% formaldehyde for fixation yielded the largest fold change between positive and negative controls, indicating that 0.2% Tween 20 and 4% formaldehyde are acceptable conditions for the target assay (Figure 126).
Experimental Details
Primary antibody: CST-9101
Secondary antibody: IRDye® 800CW Goat Anti-Rabbit (PN 926-32211)
Normalization method: CellTag™ 700 Stain (PN 926-41090)
Blocking buffer: Intercept® (PBS) Blocking Buffer (PN 927-70001)
Analysis software: Empiria Studio® Software using the [Preset] Fixation and Permeabilization Evaluation Plate Template
Acquisition Software: LI‑COR® Acquisition Software
Imaging system: Odyssey M Imager
Results
Choosing a Blocking Buffer
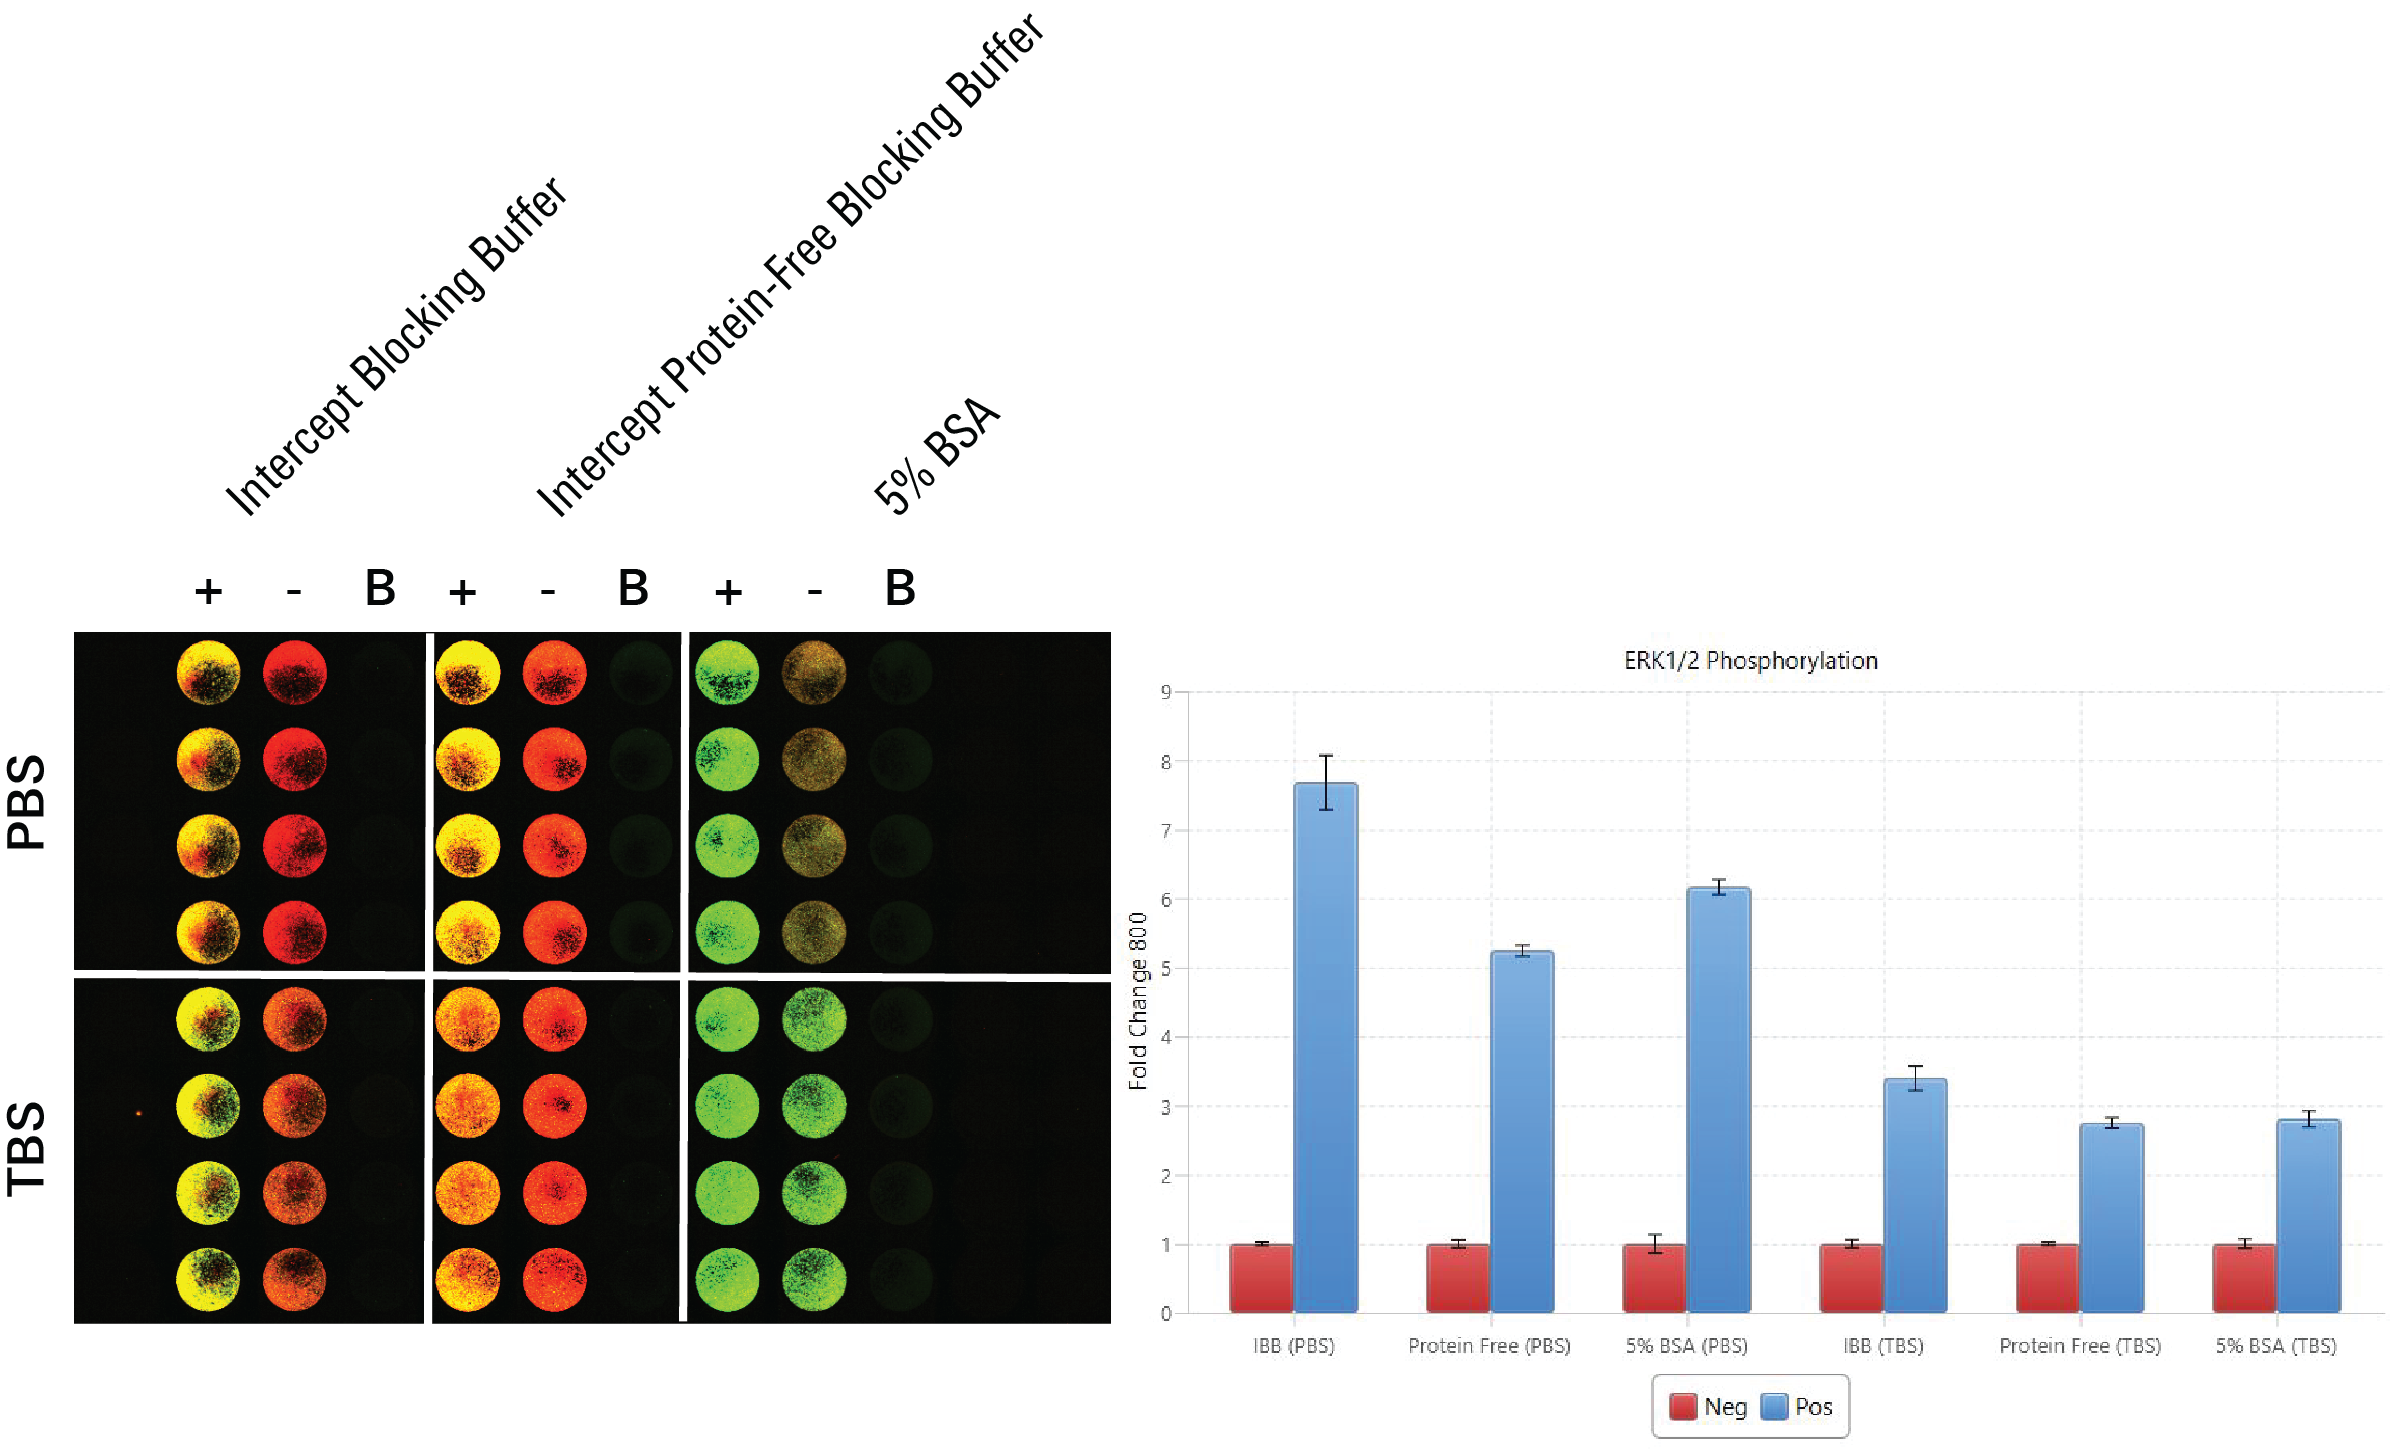
In these experiments, a variety of blocking buffers were evaluated via In‑Cell Western Assay to determine the best blocking buffer for the target assay.
Key finding: The same blocking buffer performed well for pan-ERK1 detection and p-ERK1/2 detection, so it was chosen for use in the target assay.
Blocking Buffer Evaluation | In-Cell Western | p-ERK1/2
In this experiment, blocking buffers were evaluated by determining which blocking buffer was associated with the largest fold change difference for p-ERK1/2 signal detected in positive controls (TPA-treated HeLa WT) and p-ERK1/2 signal detected in negative controls (U0126-treated HeLa WT).
Key finding: Intercept® (PBS) Blocking Buffer showed the best fold change between positive and negative controls, so it makes sense to use as the blocking buffer for detecting p-ERK1/2 in the target assay (Figure 127).
Experimental Details
Target: p-ERK1/2
Primary antibody: CST – 9101
Secondary antibody: IRDye® 800CW Goat Anti-Rabbit (PN 926-32211)
Normalization method: CellTag™ 700 Stain (PN 926-41090)
Fixation/Permeabilization: 3.7% Formaldehyde + 0.2% Tween 20
Analysis software: Empiria Studio® Software using the [Preset] Blocker Evaluation (Two Antibodies) Plate Template
Acquisition Software: LI‑COR® Acquisition Software
Imaging system: Odyssey M Imager
Results
Blocking Buffer Evaluation | In-Cell Western | pan-ERK1 and p-ERK1/2
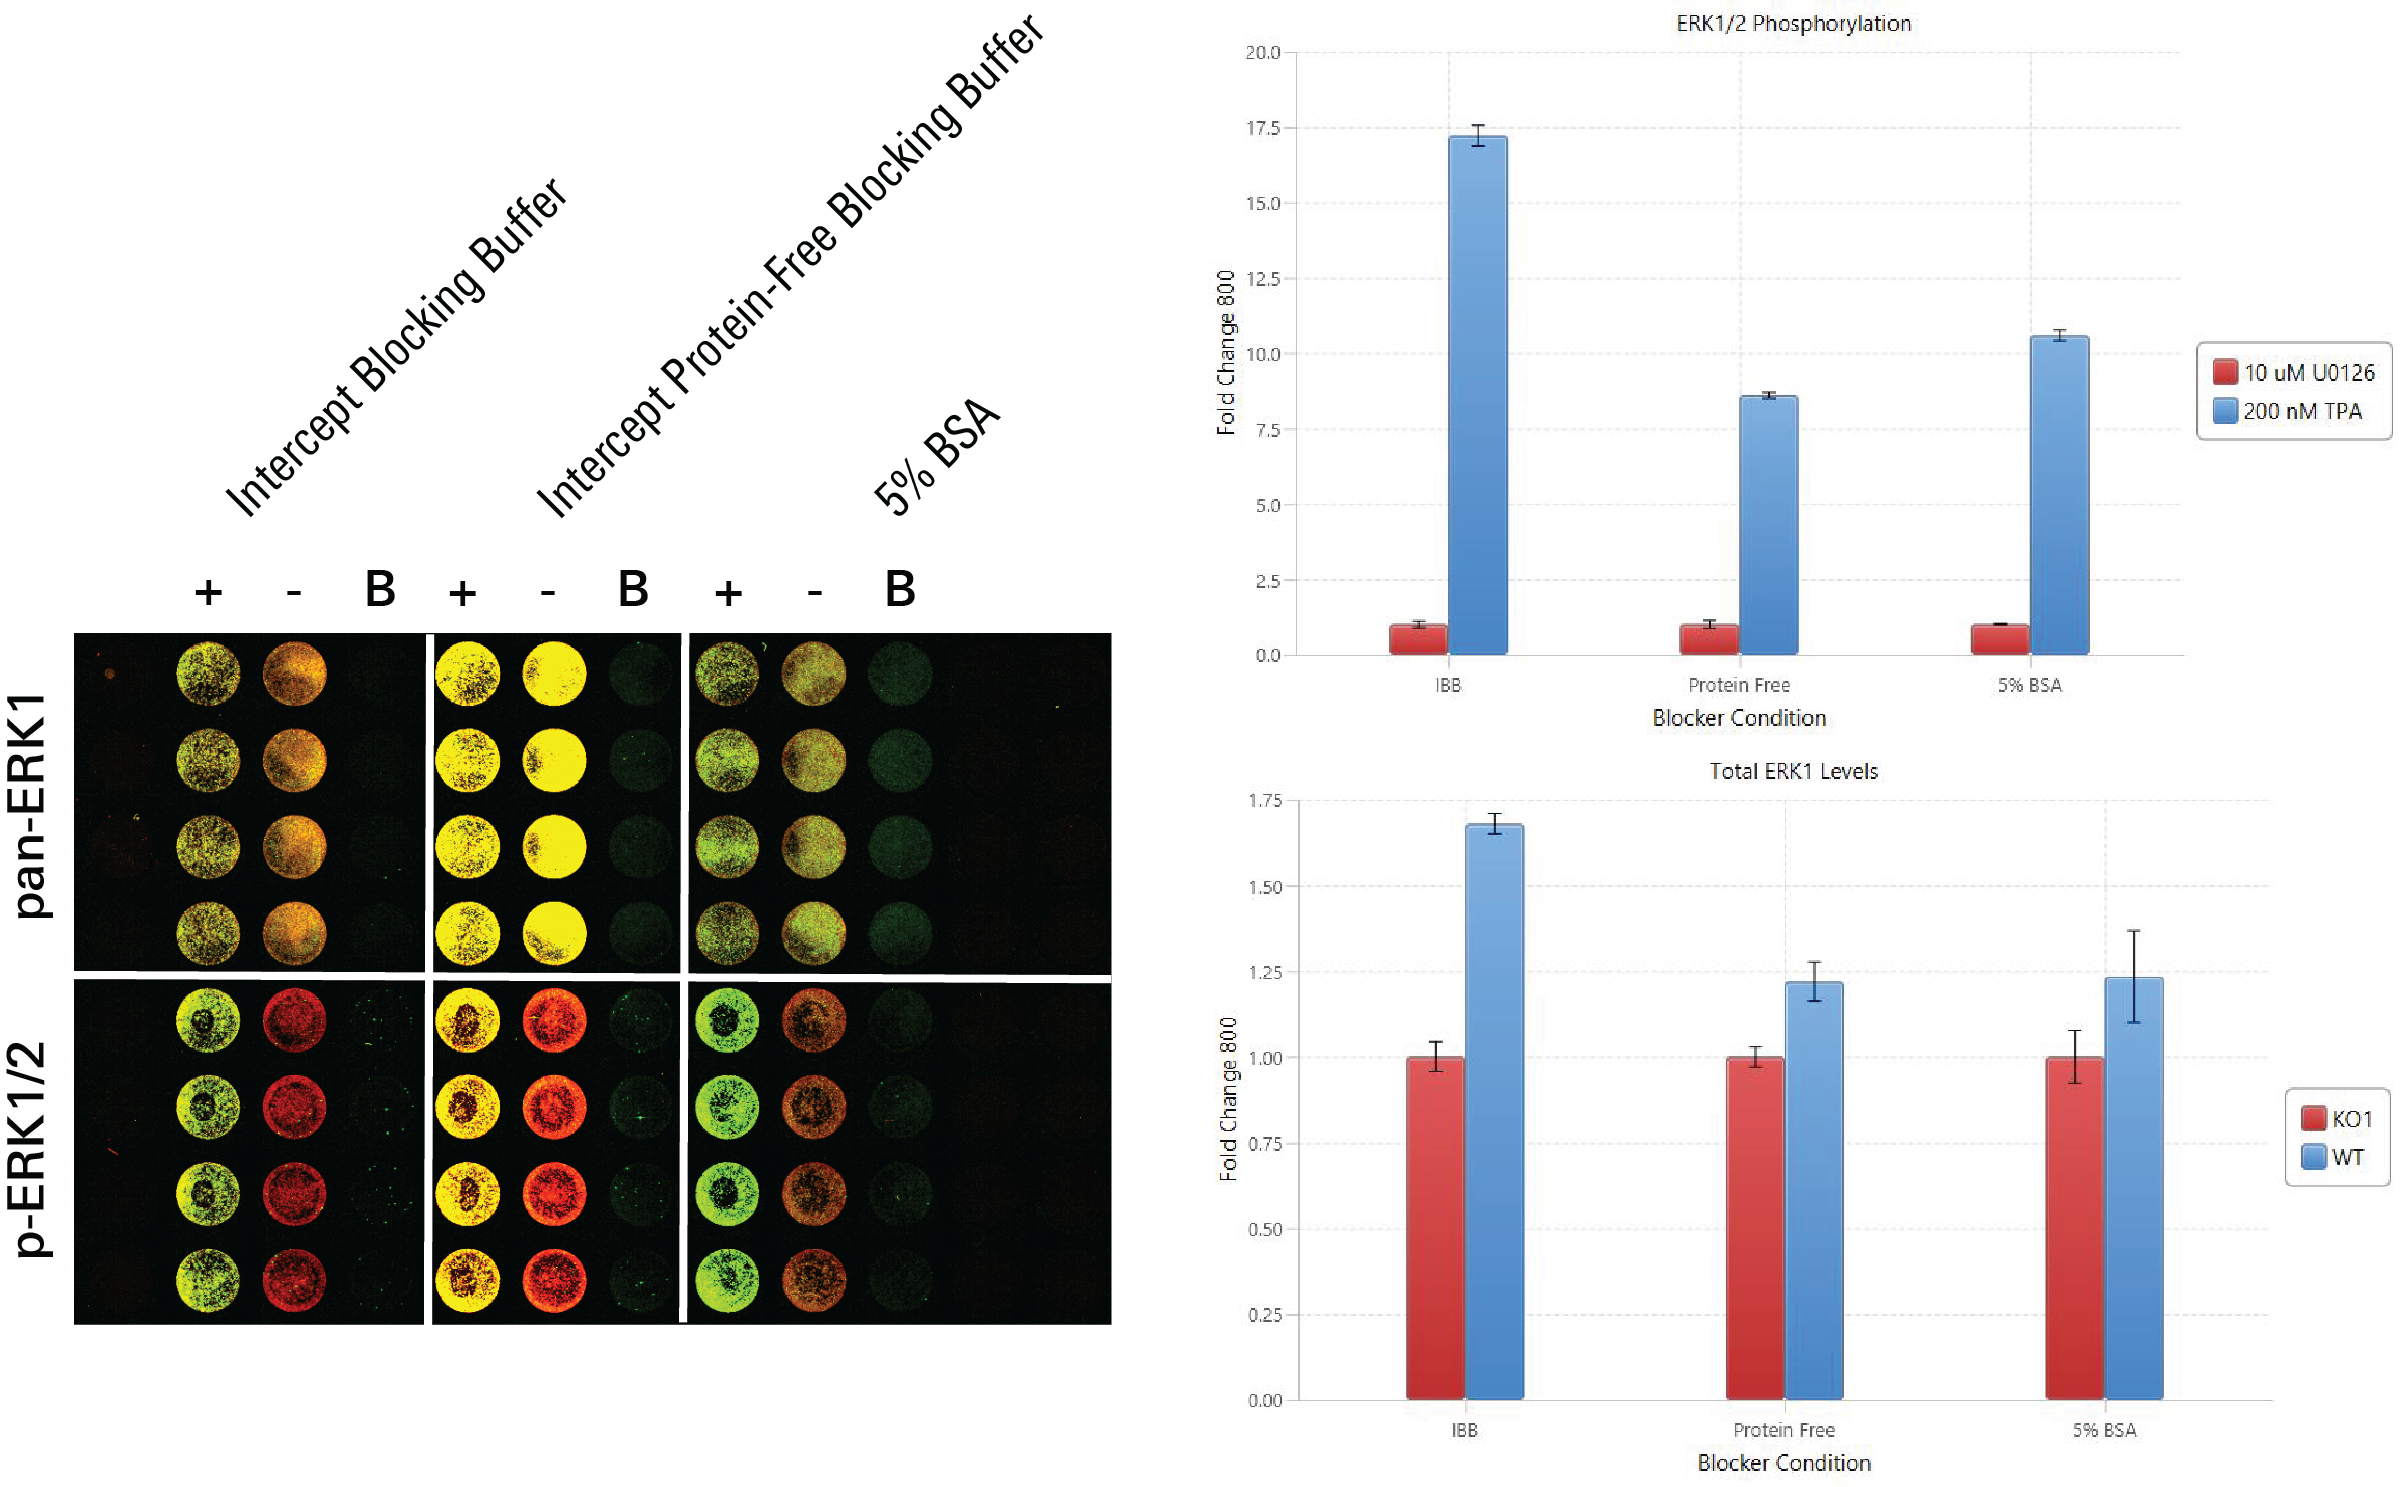
In this experiment, blocking buffers were evaluated by determining which blocking buffer was associated with the largest fold change difference between positive and negative controls. For pan-ERK1, positive controls were HeLa WT, and negative controls were HeLa KO1 cells. For p-ERK1/2, positive controls were TPA-treated HeLa WT and negative controls were U0126-treated HeLa WT.
Key finding:Intercept® (PBS) Blocking Buffer showed the best fold change between positive and negative controls for both antibodies, so it is the best from the options tested to use as the blocking buffer in the target assay (Figure 128).
Experimental Details
Target: pan-ERK1 and p-ERK1/2
Primary antibodies: Invitrogen MA5-15896 and CST - 9101
Secondary antibody: IRDye® 800CW Goat Anti-Rabbit (PN 926-32211) and IRDye 800CW Goat Anti-Mouse (PN 926-32210)
Normalization method: CellTag™ 700 Stain (PN 926-41090)
Fixation/Permeabilization: 3.7% Formaldehyde + 0.2% Tween® 20
Analysis software: Empiria Studio® Software using the [Preset] Blocker Evaluation (Two Antibodies) Plate Template
Acquisition Software: LI‑COR® Acquisition Software
Imaging system: Odyssey M Imager
Results
Determining Antibody Concentration
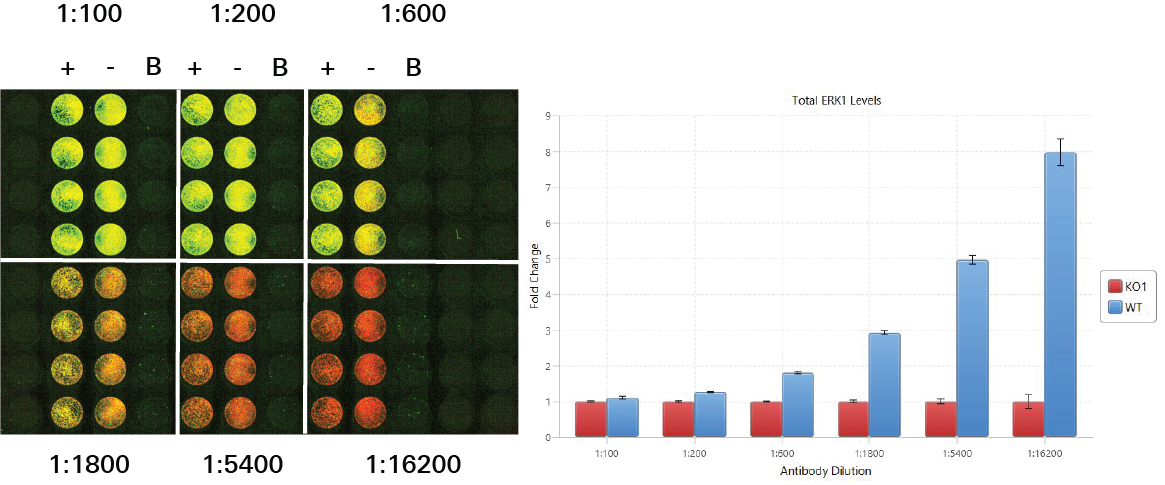
In these experiments, In‑Cell Western Assays were performed to determine the antibody concentration that provides the largest fold change between positive and negative controls, as well as minimal background.
Antibody Titration | In-Cell Western | pan-ERK1
In this experiment, six antibody concentrations were compared to see which would work best for the target assay. A fold change was calculated for pan-ERK1 signal detected in positive controls (HeLa WT) and negative controls (HeLa ERK1 KO1) in each of the six antibody concentrations. In general, larger fold changes are better, but other factors must also be considered.
Key finding: The antibody concentration 1:5,000 was chosen as the antibody concentration for the pan-ERK1 antibody (Figure 129).
The 1:5,400 antibody concentration option produced a large fold change and sufficient signal. Although the concentration 1:16,200 produced a larger fold change, the signal was too low.
Experimental Details
Target: pan-ERK1
Primary antibody: Human ERK1 (R&D Systems MAB1940)
Secondary antibody: IRDye® 800CW Goat Anti-Mouse (PN 926-32210)
Normalization method: CellTag™ 700 Stain (PN 926-41090)
Blocking buffer: Intercept® (PBS) Blocking Buffer (PN 927-70001)
Cells: HeLa WT and HeLa ERK1 KO
Analysis Software: Empiria Studio® Software with the [Preset] Antibody Titration (Two Antibodies) Plate Template
Acquisition Software: LI‑COR® Acquisition Software
Imaging System: Odyssey M Imager
Results
Antibody Titration | In-Cell Western | p-ERK1/2
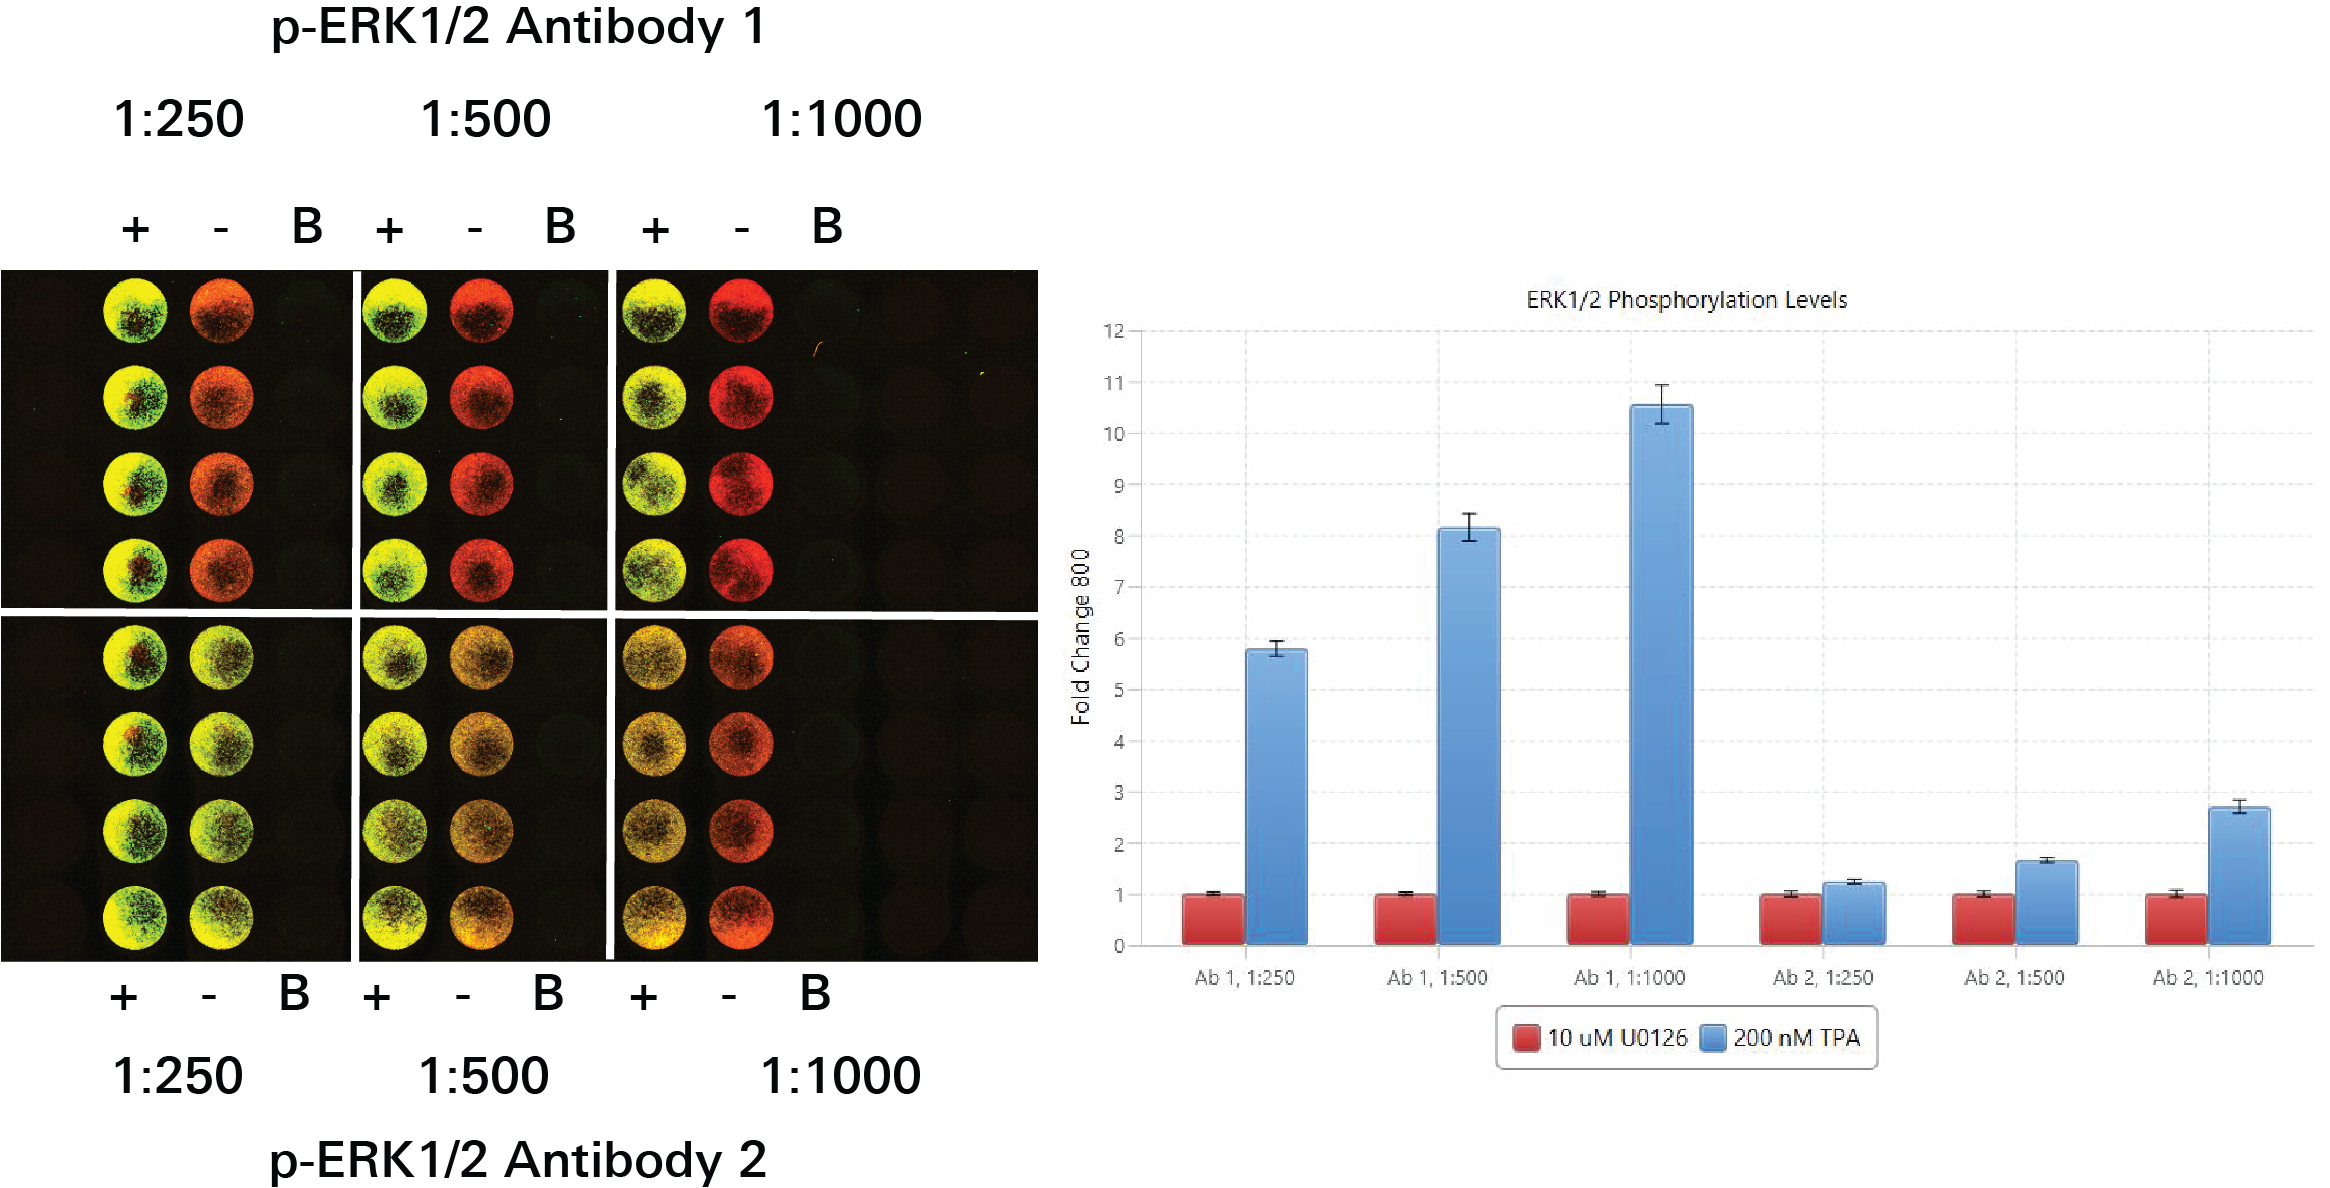
In this experiment, six antibody concentrations were compared to see which would work best for the target assay. A fold change was calculated for p-ERK1/2 signal detected in positive controls (TPA-treated HeLa WT) and negative controls (U0126) in each of the six antibody concentrations. In general, larger fold changes are better, but other factors must also be considered.
Key finding: The 1:1,000 antibody concentration option was chosen, because it produced a large fold change and sufficient signal (Figure 130).
Experimental Details
Target: p-ERK1/2
Primary antibody 1: CST - 9101
Primary antibody 2: CST - 5726
Secondary antibody: IRDye® 800CW Goat Anti-Rabbit (PN 926-32211)
Normalization method: CellTag™ 700 Stain (PN 926-41090)
Blocking buffer: Intercept® (PBS) Blocking Buffer (PN 927-70001)
Cells: HeLa
Analysis Software: Empiria Studio® Software with the [Preset] Antibody Titration (Two Antibodies) Plate Template
Acquisition Software: LI‑COR® Acquisition Software
Imaging System: Odyssey M Imager
Results
Determining Z'-Factor
In this section, In‑Cell Western Assays were performed with the conditions chosen from previous assay development steps to calculate a Z'-Factor. The Z'-Factor indicates the robustness of the assay. See Z’-Factor Determination for more information.
Key finding: Assays for pan-ERK1 detection and p-ERK1/2 detection both yielded high Z'-Factor values that indicate a quality assay.
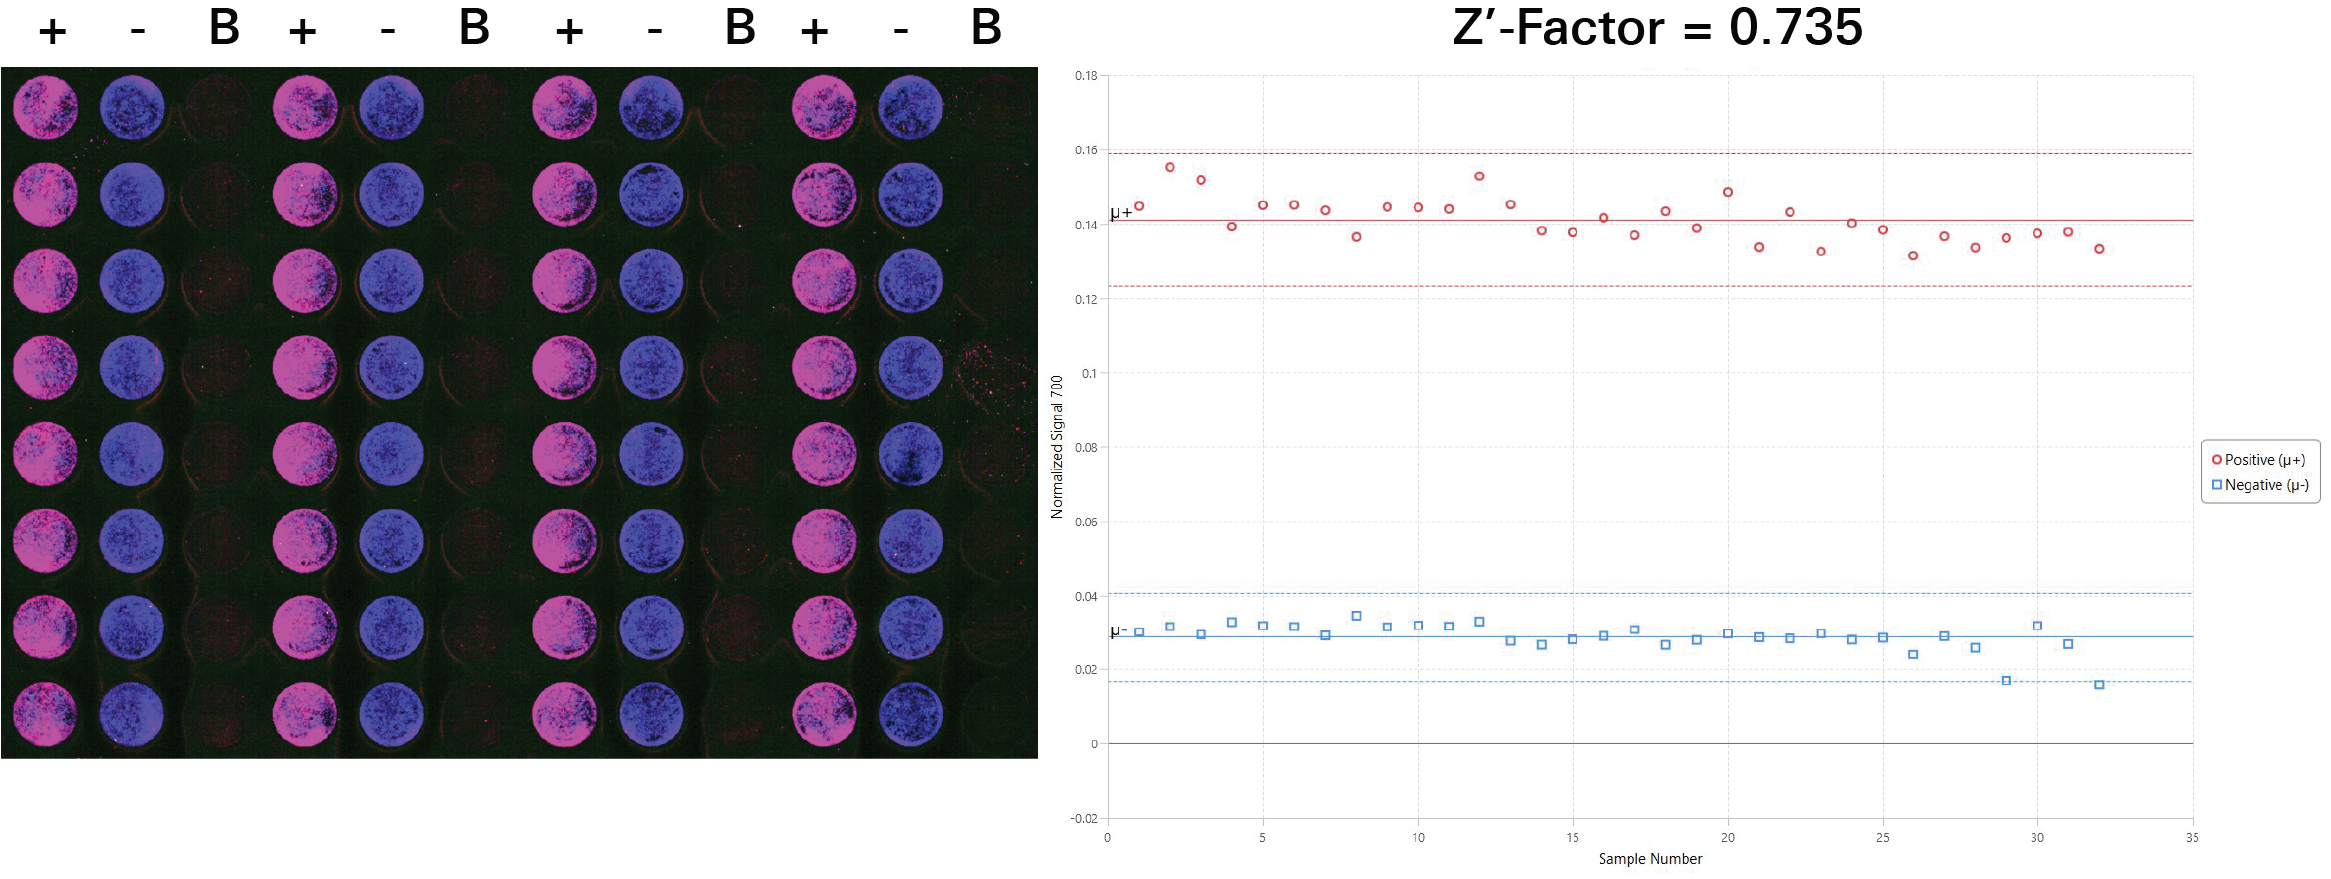
Z'-Factor Determination | In-Cell Western | pan-ERK1
Key finding: This assay was determined to have a Z'-Factor of 0.735, indicating it is a high quality assay (Figure 131).
Experimental Details
Target: pan-ERK1
Primary antibody: Human ERK1 (R&D Systems MAB1940)
Secondary antibody: IRDye® 680RD Goat Anti-Mouse (PN 926-68070)
Normalization method: CellTag™ 520 Stain (PN 926-41094)
Fixation/Permeabilization: 3.7% formaldehyde and 0.2% Tween® 20
Blocking buffer: Intercept® (PBS) Blocking Buffer (PN 927-70001)
Cells: HeLa
Positive control: HeLa WT
Negative control: ERK1 KO1
Analysis Software: Empiria Studio® Software with the [Preset] Z-Factor Determination 1
Acquisition Software: LI‑COR® Acquisition Software
Imaging System: Odyssey M Imager
Results
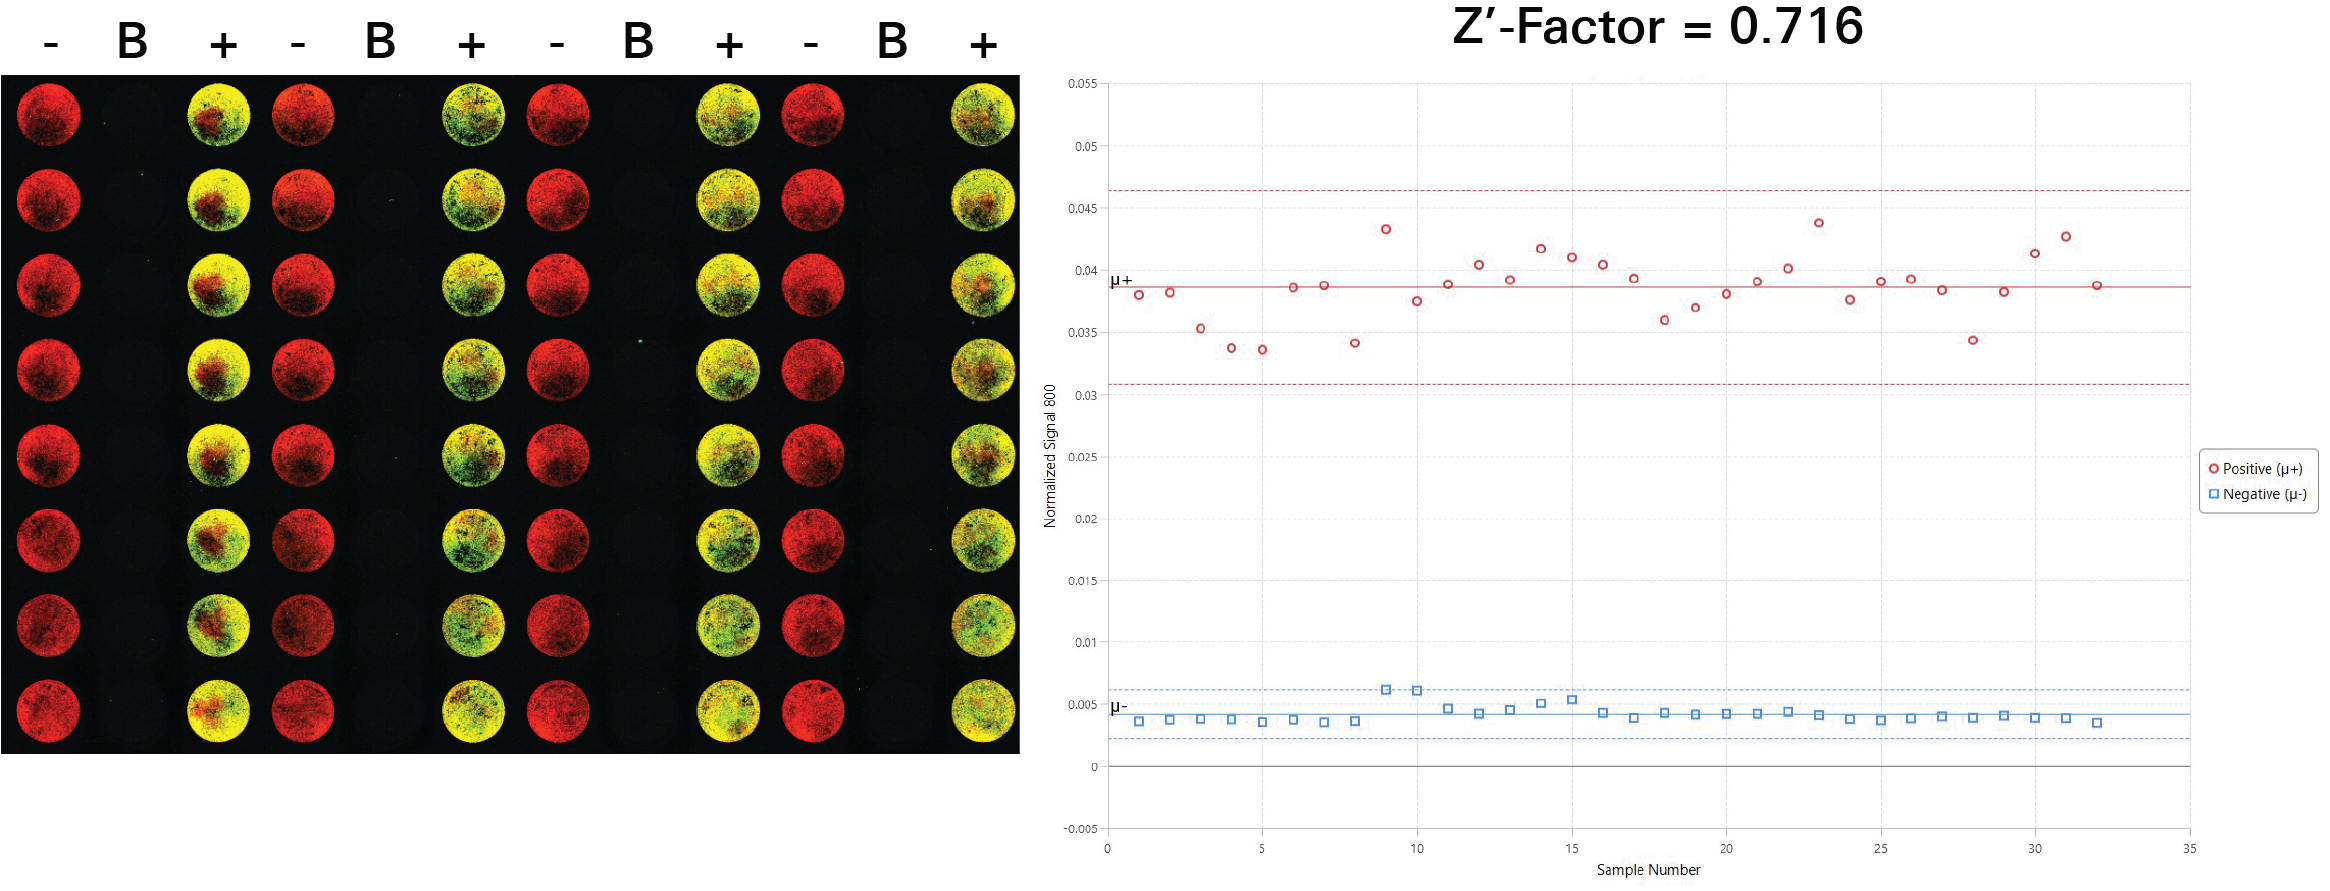
Z'-Factor Determination | In-Cell Western | p-ERK1/2
Key finding: This assay was determined to have a Z'-Factor of 0.716, indicating it is a high quality assay (Figure 132).
Experimental Details
Target: p-ERK1/2
Primary antibody: CST-9101
Secondary Antibody: IRDye® 800CW Goat Anti-Rabbit IgG (PN 926-32211)
Normalization method: CellTag™ 700 Stain (PN 926-41090)
Fixation/Permeabilization: 3.7% formaldehyde and 0.2% Tween® 20
Blocking buffer: Intercept® (PBS) Blocking Buffer (PN 927-70001)
Cells: HeLa
Positive control: TPA-treated HeLa WT
Negative control: U0126-treated HeLa WT
Analysis Software: Empiria Studio® Software with the [Preset] Z-Factor Determination 2Plate Template
Acquisition Software: LI‑COR® Acquisition Software
Imaging System: Odyssey M Imager
Results
Determining If Target Assays Meet the Goal
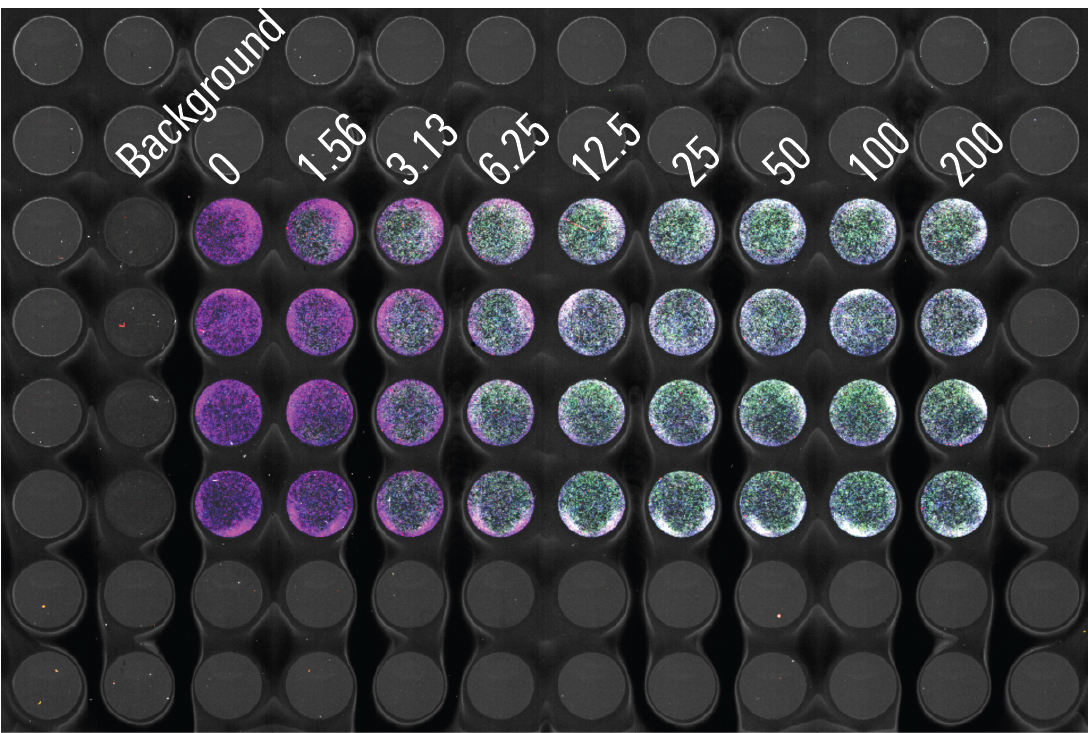
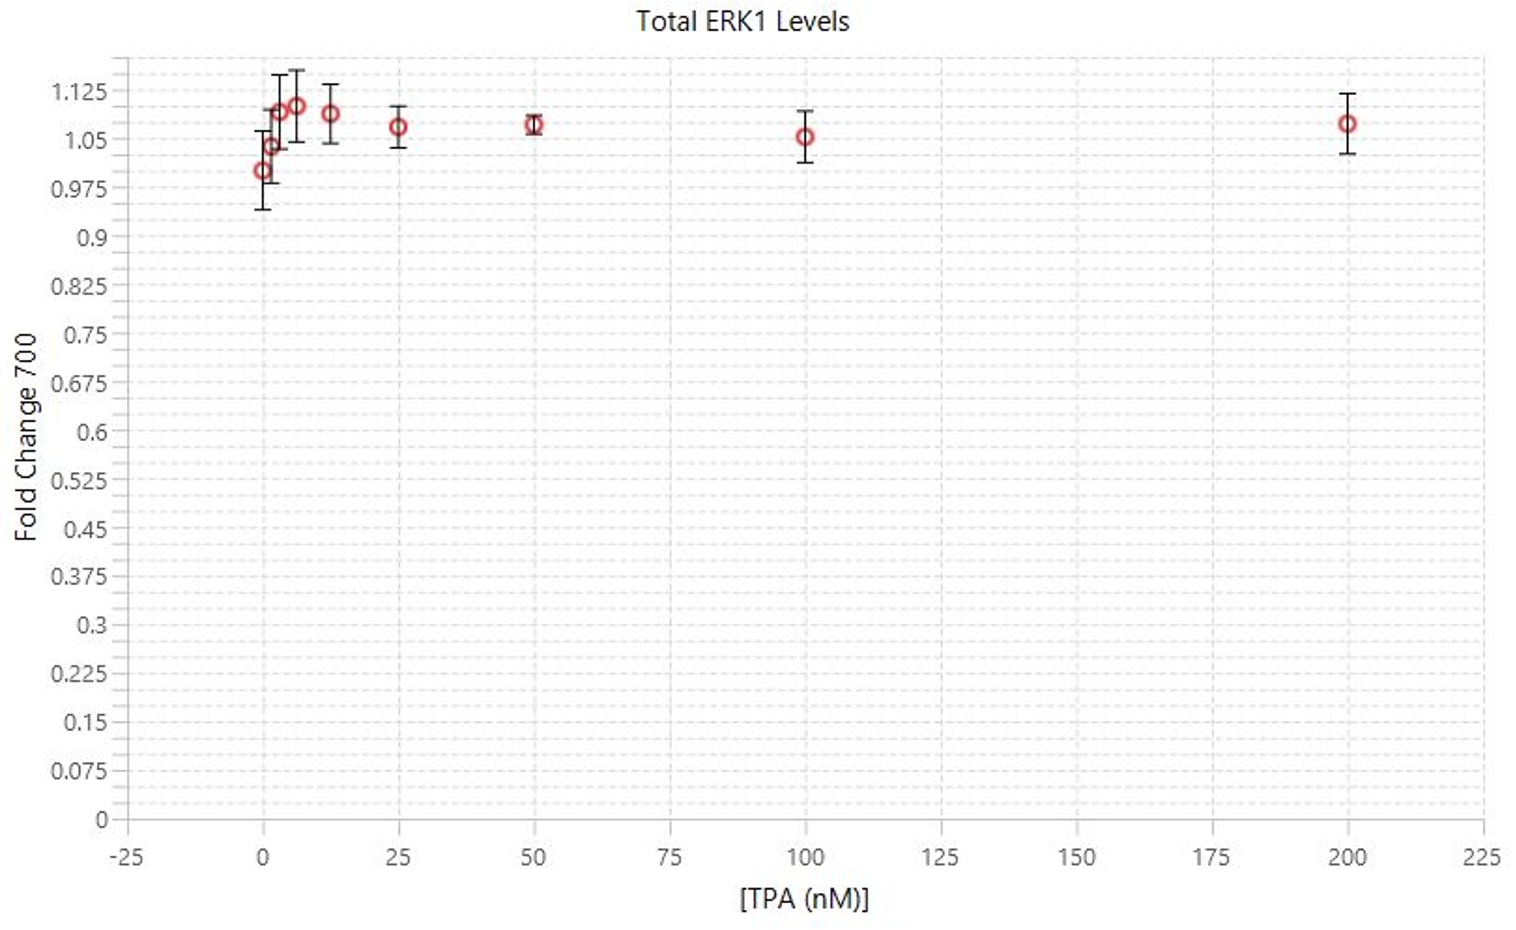
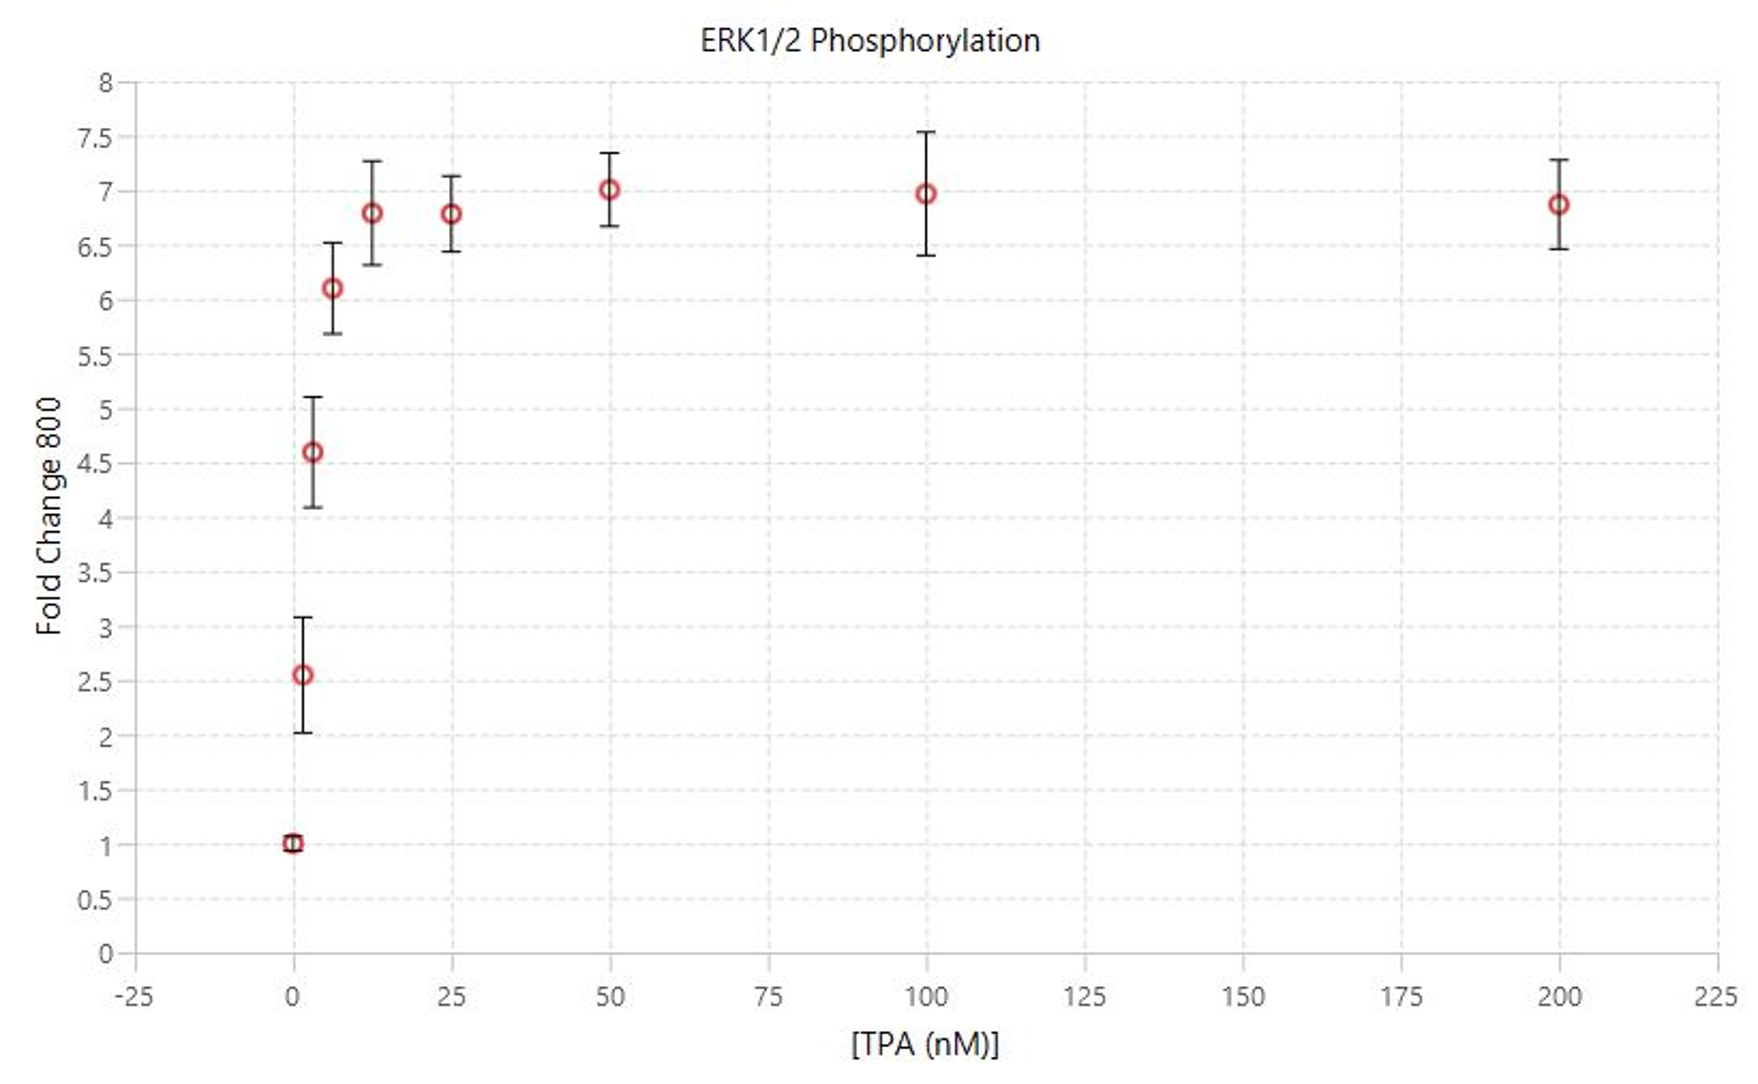
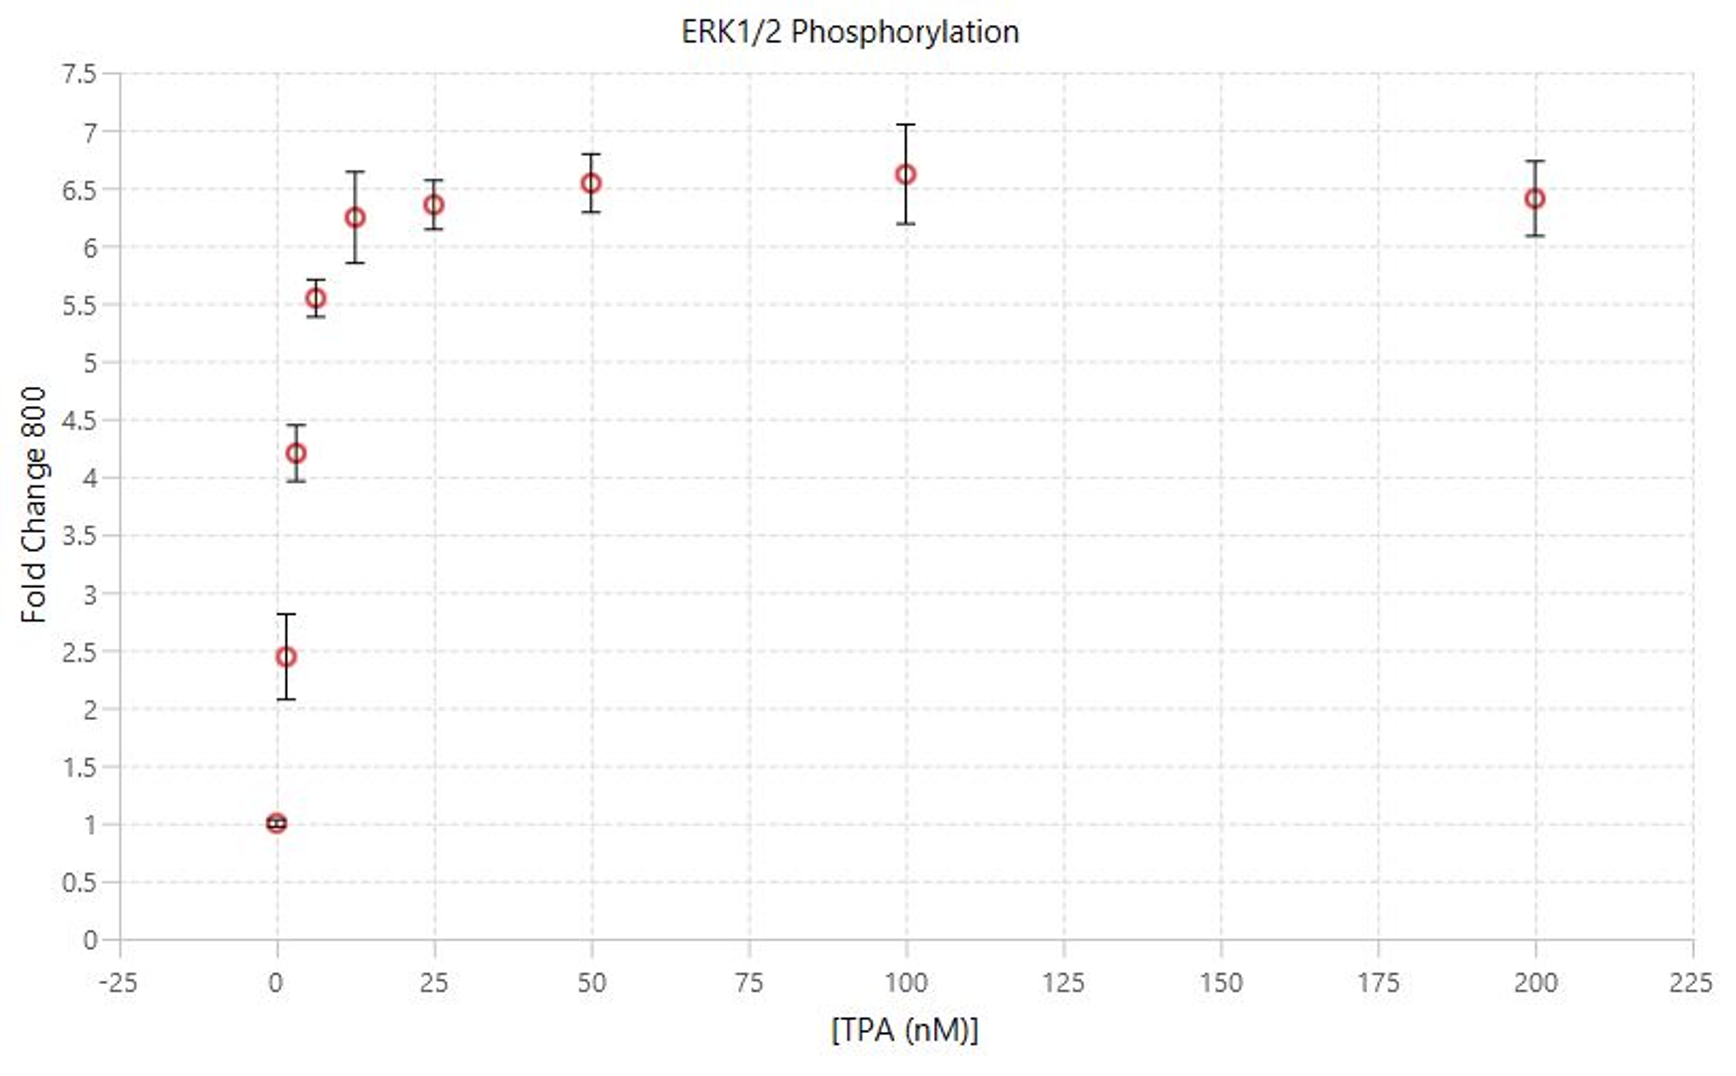
TPA Dose Response | In-Cell Western | pan-ERK1 and p-ERK1/2
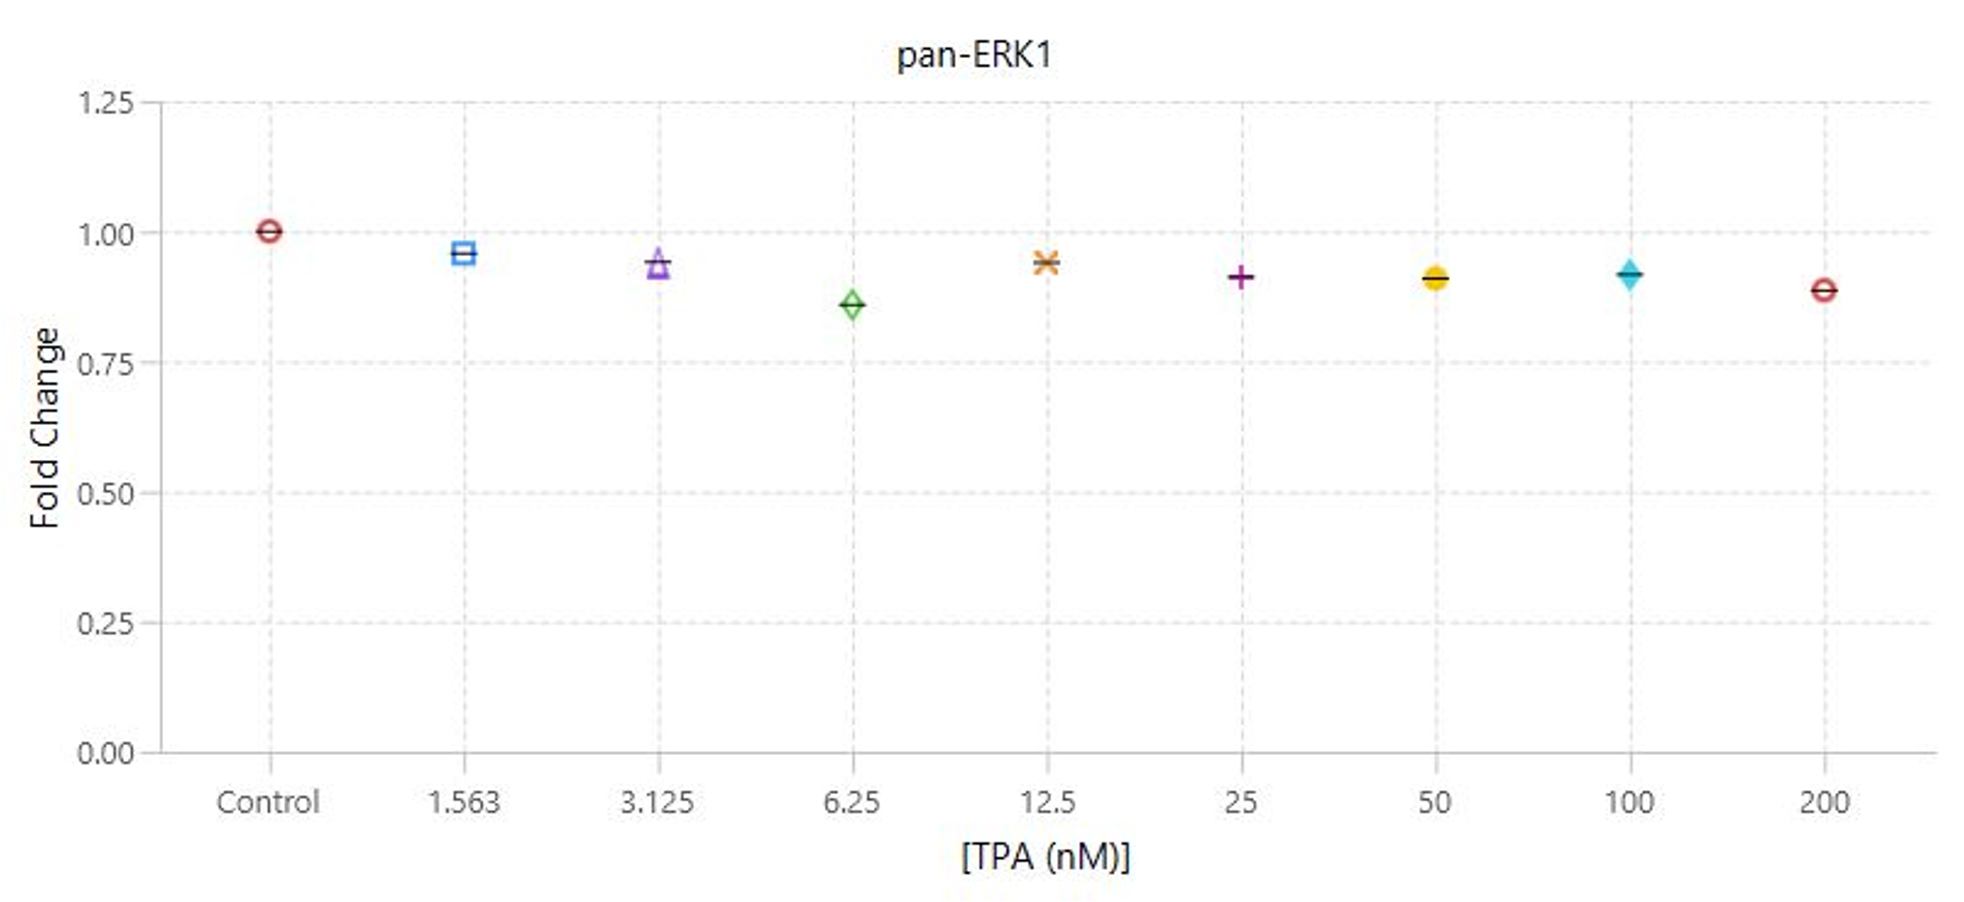
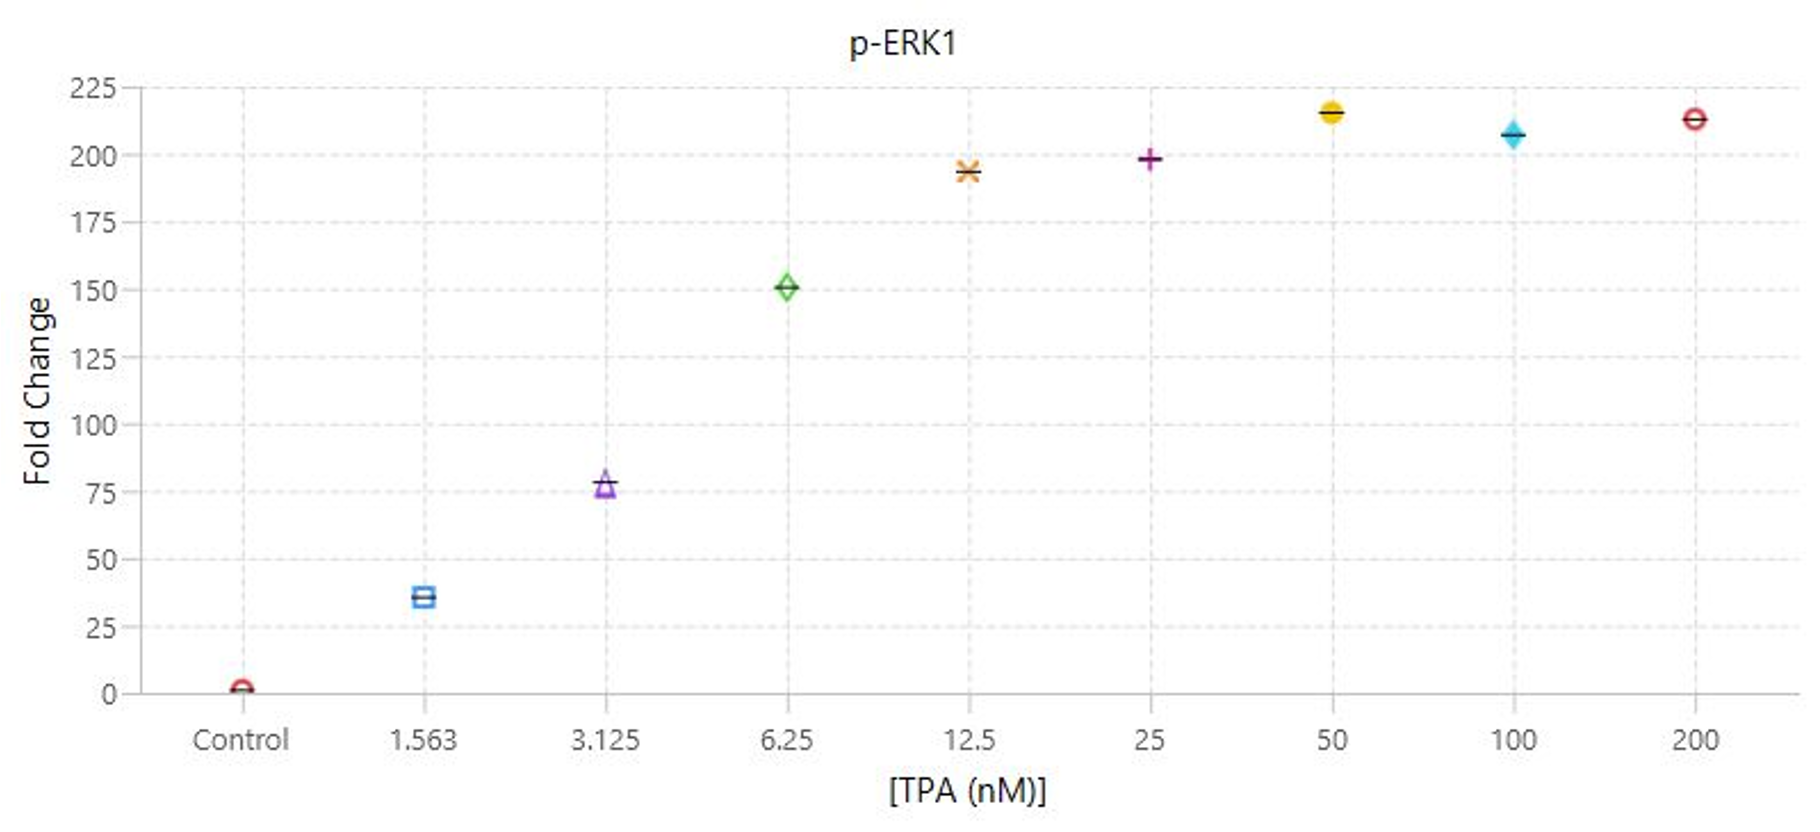
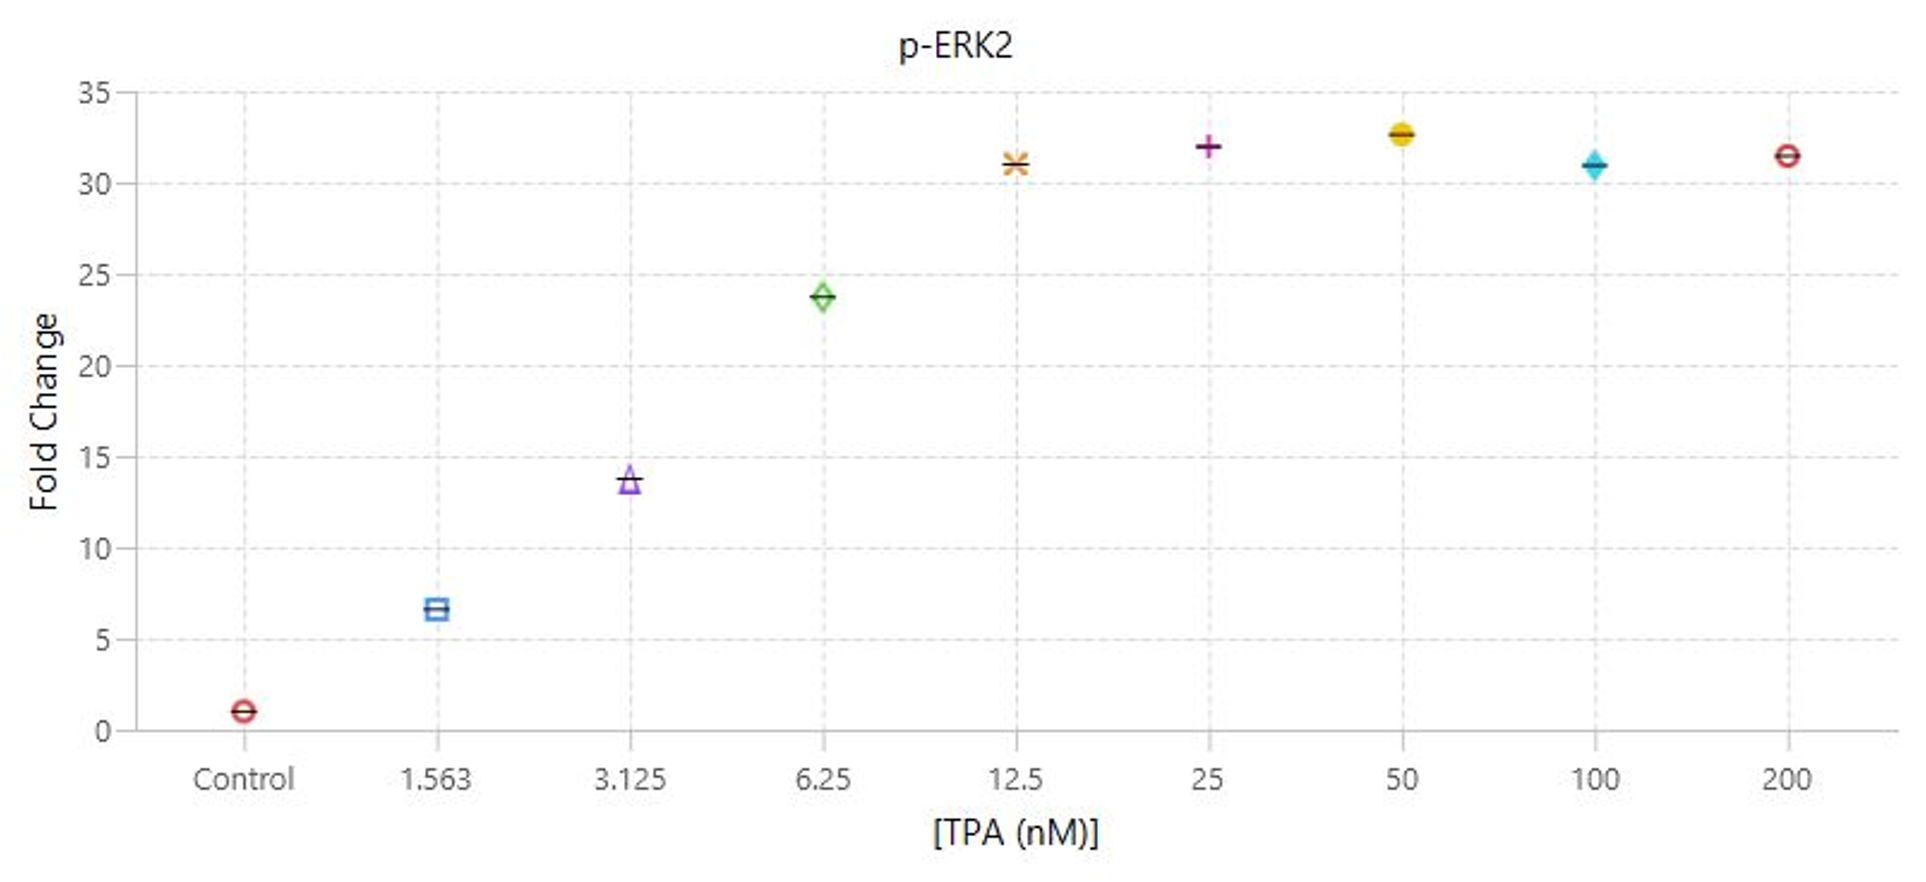
This experiment is the first example of a target assay run using the conditions determined in the assay development experiments.
Key finding: EC50 values were calculated (Figure 133) that match expected results and closely match the EC50 calculated in the Western blot analog of this experiment (see TPA Dose Response | Western Blot | pan-ERK1 and p-ERK1/2).
Experimental Details
Targets: pan-ERK1 and p-ERK1/2
Primary antibodies: MAB-1940 and CST-1901
Normalization methods: CellTag™ 520 Stain (PN 926-41094) and pan-ERK1
Blocking buffer: Intercept® (PBS) Blocking Buffer (PN 927-70001)
Fixation/Permeabilization: 3.7% Formaldehyde and 0.2% Tween® 20
Analysis software: Empiria Studio® Software with the [Preset] Target Analysis Plate Template
Acquisition software: LI‑COR® Acquisition Software
Imaging system: Odyssey M Imager
Results
| A | B |
| C | D |
TPA Dose Response | Western Blot | pan-ERK1 and p-ERK1/2
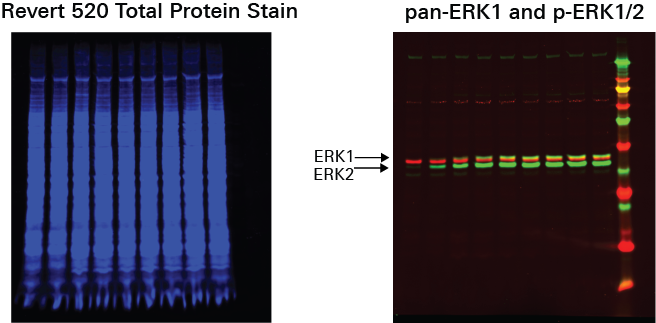
This experiment is a Western blot analog to the In‑Cell Western Assay TPA Dose Response experiment.
Key finding: EC50 values were calculated (Figure 134) that match expected results and closely match the EC50 calculated in the In‑Cell Western Assay TPA Dose Response experiment (see TPA Dose Response | In-Cell Western | pan-ERK1 and p-ERK1/2).
Experimental Details
Targets: pan-ERK1 and p-ERK1/2
Primary antibodies: MAB-1940 and CST-1901
Normalization method: Revert™ 520 Total Protein Stain (PN 926-10011)
Blocking buffer: Intercept® (PBS) Blocking Buffer (PN 927-70001)
Analysis software: Empiria Studio® Software
Acquisition software: LI‑COR® Acquisition Software
Imaging system: Odyssey M Imager
Results
| A | B |
| C | D |
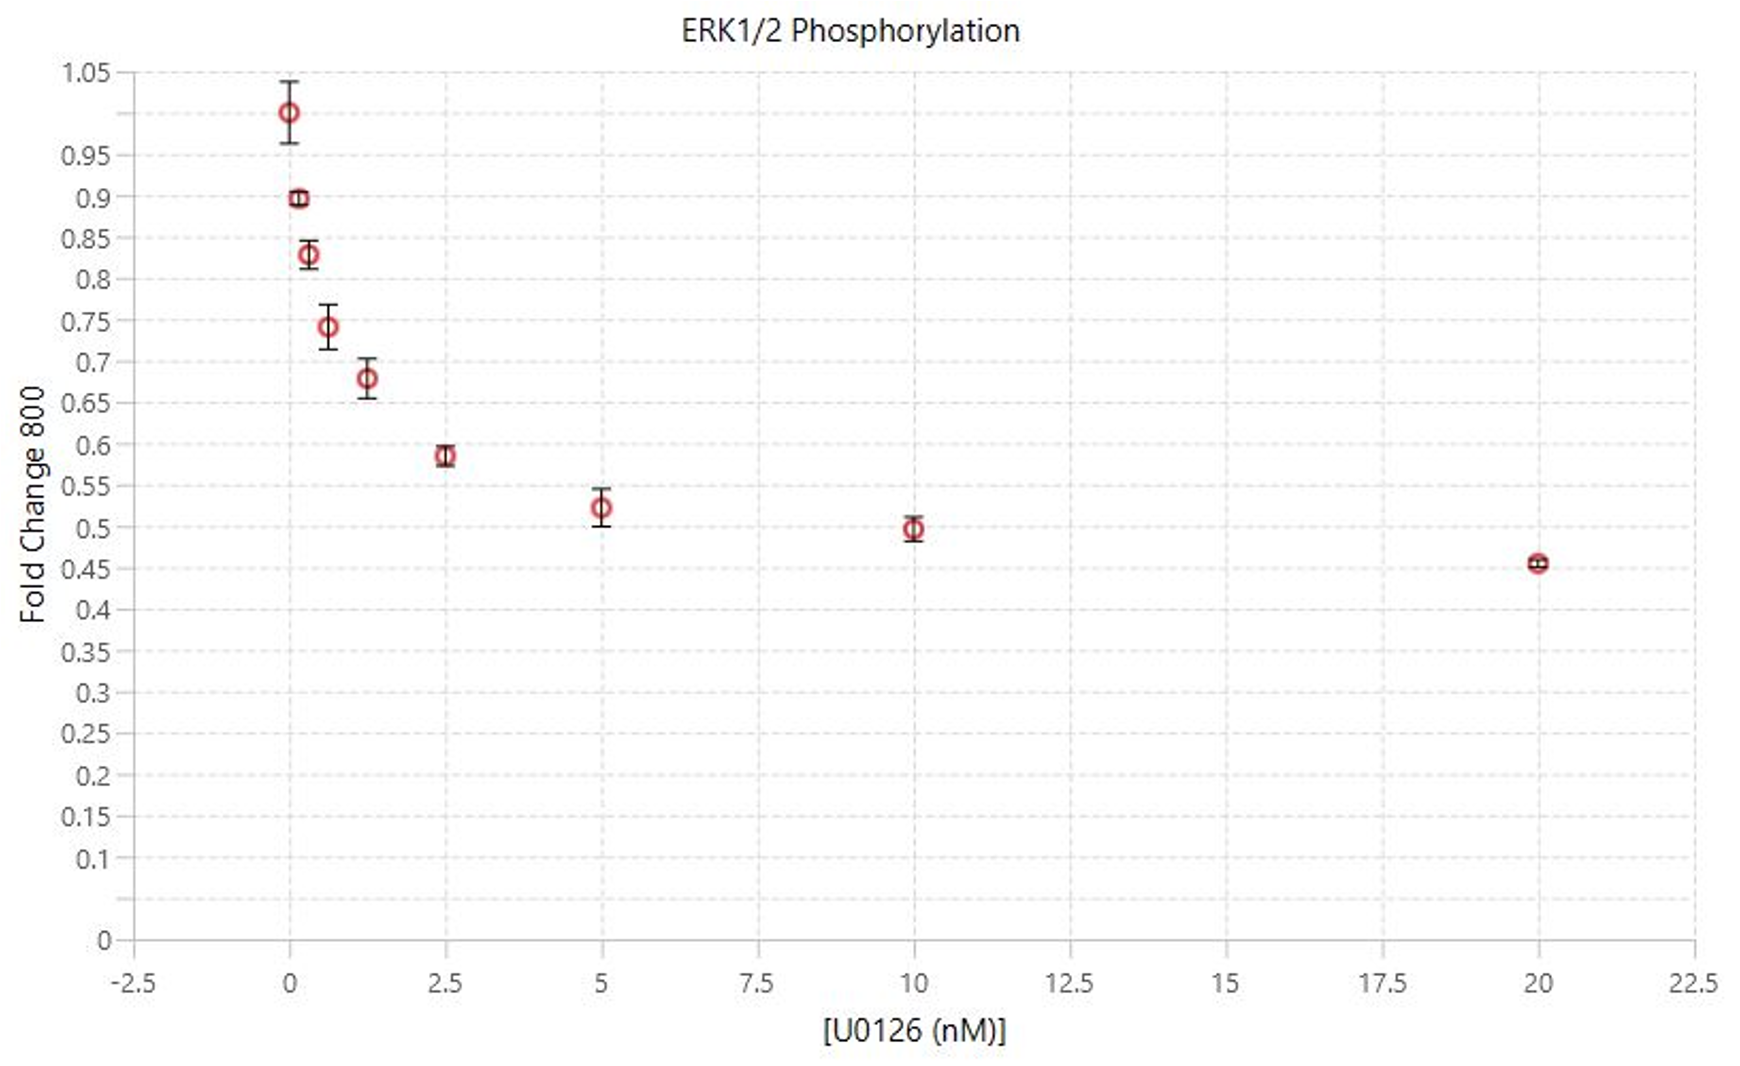
Measuring U0126 Inhibition | In-Cell Western | pan-ERK1 and p-ERK1/2
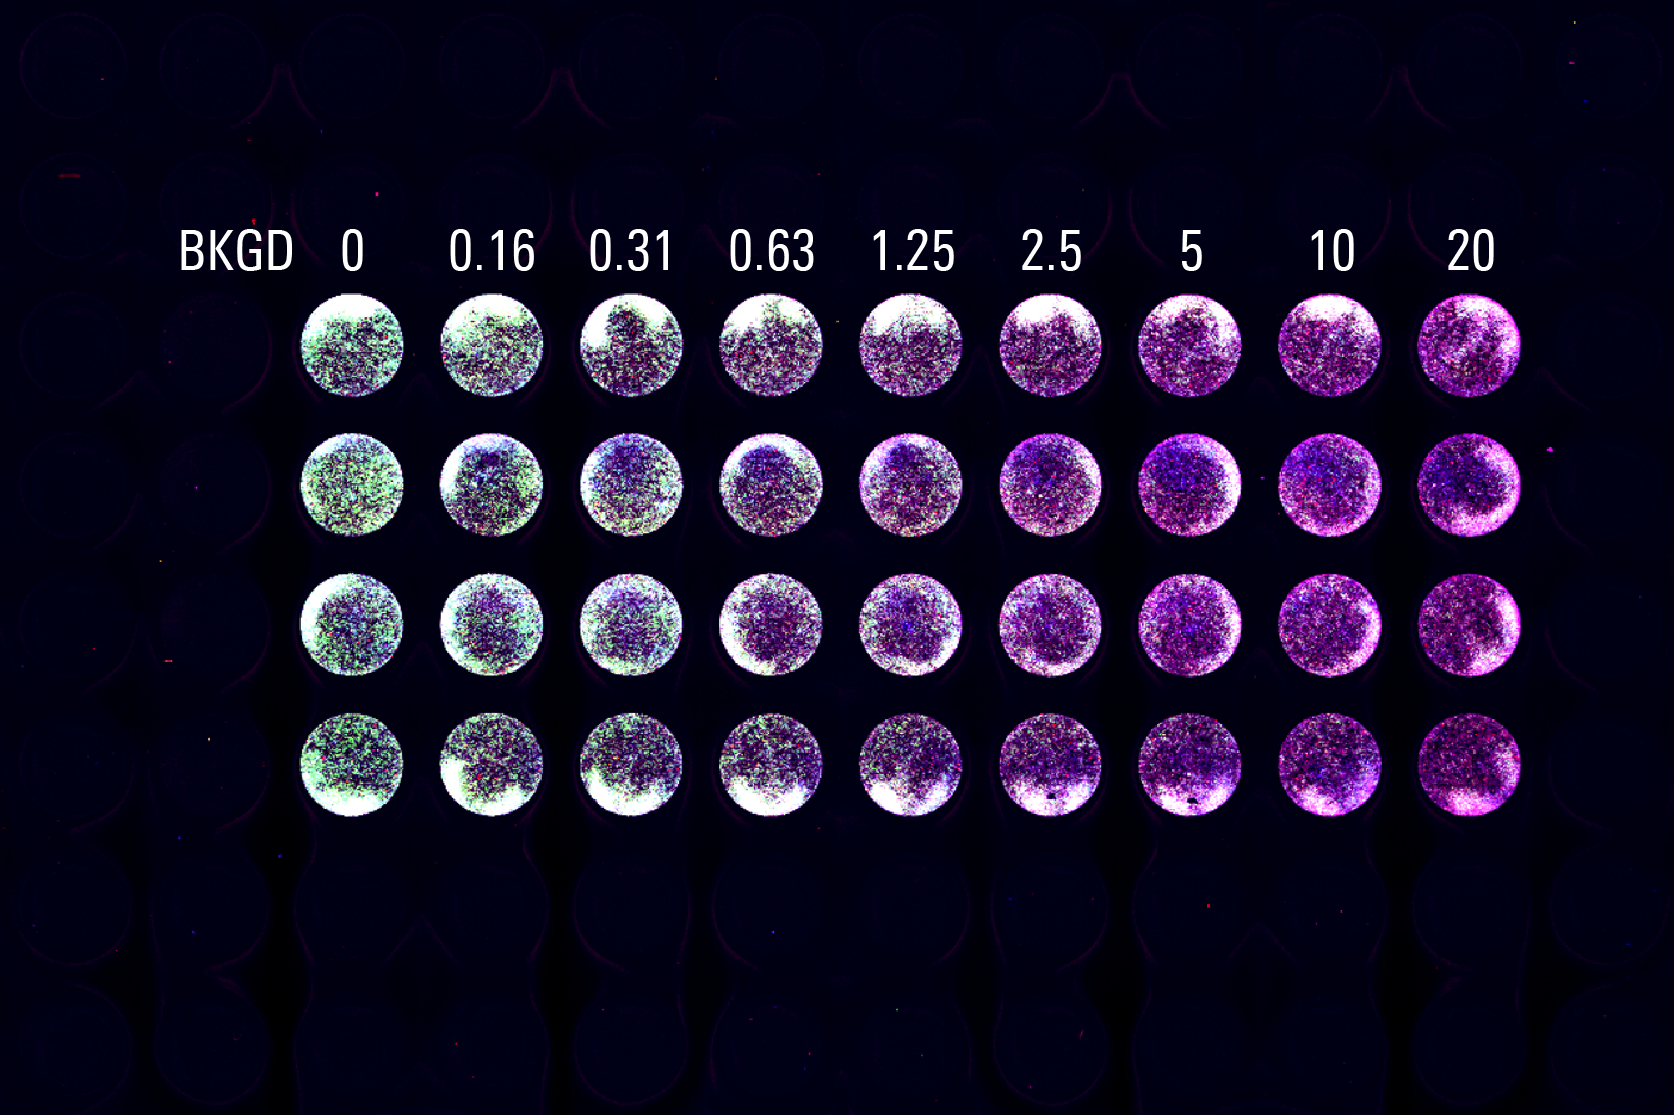
This experiment is an example Assay run to find the IC50 for U0126 inhibition using conditions from the assay development process.
Key finding: An IC50 was calculated in the low micromolar range (Figure 135), matching expectations.1
Experimental Details
Targets: pan-ERK1 and p-ERK1/2
Primary antibodies: MAB-1940 and CST-1901
Normalization methods: CellTag™ 520 Stain (PN 926-41094) and pan-ERK1
Blocking buffer: Intercept® (PBS) Blocking Buffer (PN 927-70001)
Fixation/Permeabilization: 3.7% Formaldehyde and 0.2% Tween® 20
Analysis software: Empiria Studio® Software with the [Preset] Target Analysis Plate Template
Acquisition software: LI‑COR® Acquisition Software
Imaging system: Odyssey M Imager
Results
| A | B |

| C | D |

Conclusion
The assay development project reached its goal. Target assays were developed that can quantify changes in p-ERK1/2 expression, as expected.