Optical imaging is ideal for observing and characterizing delivery of your therapeutic in live animals and excised organs. Optical modalities include direct detection using near-infrared (NIR) fluorescent dyes and indirect detection using bioluminescence or NIR fluorescent proteins.
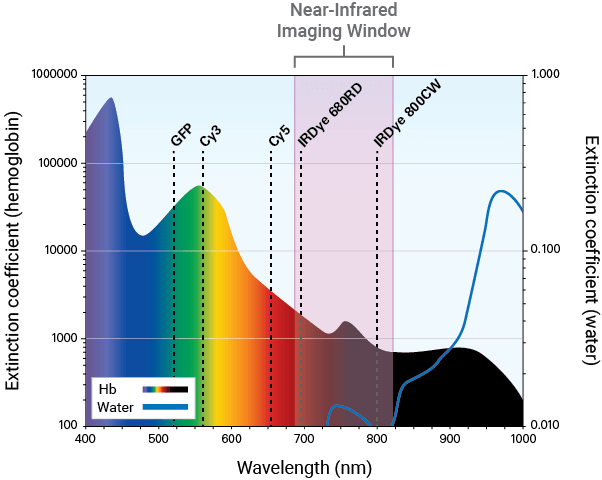
NIR fluorescence detection (680 nm to 820 nm) is a sensitive and efficient modality for in vivo and ex vivo studies. It can be used to illuminate features, such as tumors and vasculature, deep within the body.
NIR imaging aids in visualizing and monitoring the delivery of your therapeutic. Developing a dye-labeled therapeutic involves several validation steps. Characterization of therapeutics should be done in vitro to confirm specificity to the target before moving to animal studies, as in vivo studies can be very costly.
Comprehensive in vitro analysis of your therapeutic can be performed using an Odyssey® Imaging System, such as the Odyssey DLx. Biological characterization of your dye-labeled therapeutic in vivo and ex vivo can follow using the Pearl® Trilogy Small Animal Imaging System.
Detection in the NIR spectrum is ideal for tracking delivery of a dye-labeled therapeutic and provides several advantages.
Autofluorescence from animal tissue is significantly lower in the NIR region. This renders tissue virtually transparent and allows for high signal-to-noise ratios and detection of your dye-labeled therapeutic and its location (e.g., tumors and other regions).
In contrast to other imaging modalities, images can be captured within seconds, allowing you to rapidly and repeatedly screen mice.
Compared to other modalities, NIR imaging is more economical.
Target specificity studies evaluate the binding specificity and affinity of your dye-labeled therapeutic to an in vivo target. These studies also help identify any non-specific interactions and potential off-target effects of your therapeutic. Cell surface receptors and transporters are the most common targets for in vivo specificity studies.
Cell surface receptors are common targets for in vivo imaging in cancer research. Tumors that over-express a cell surface receptor provide easy access for targeting molecules such as ligands, antibodies, or therapeutics. These targeting molecules bind to the receptors, and, once labeled with a NIR dye, can be evaluated in imaging studies.
For in vivo imaging of cancer, cell surface transporters such as glucose transporters can be targeted. This is because tumors are often more metabolically active than surrounding normal cells and may have an increased rate of glucose metabolism and cell surface glucose transporter activity.1, 2
Minimal autofluorescence from tissue and deep light penetration in the NIR spectrum allows sensitive detection and semi-quantitative assessment of dye-labeled therapeutic binding affinity to the intended target. Non-specific interactions can also be detected with high sensitivity to characterize potential off-target effects. Additionally, uniform laser illumination across the entire imaging area in the Pearl Trilogy ensures equal light exposure across the whole animal for effective in vivo measurement of specificity.
Examples of fluorescent probes developed against several receptor and transporter targets provide context on potential applications for other dye-labeled therapeutics. For instance, the GLUT1 glucose transporter can be targeted with a fluorescent-labeled IRDye® 2-deoxyglucose (2-DG) agent for longitudinal studies of tumor progression.3 EGF and integrin receptors can be targeted using IRDye EGF agent 4 or IRDye 800CW RGD,5, 6 respectively.
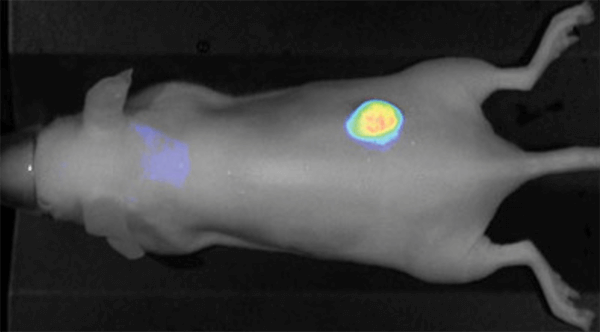
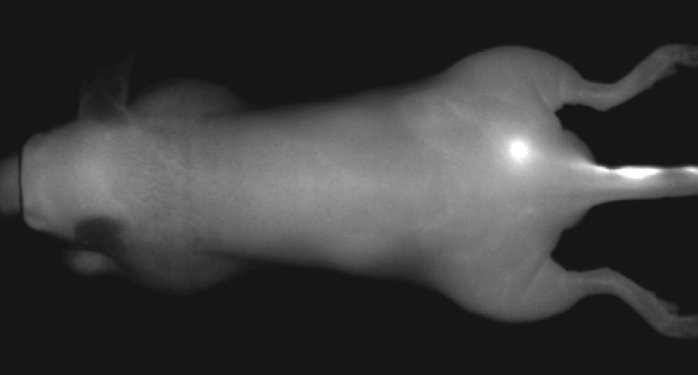
Figure 1. IRDye 800CW EGF imaged 96 h post injection. Image was captured with the Pearl Imager with pseudo-color representing the signal in the 800 nm channel overlaid on the mouse white light image. Research conducted at LI-COR Biosciences.
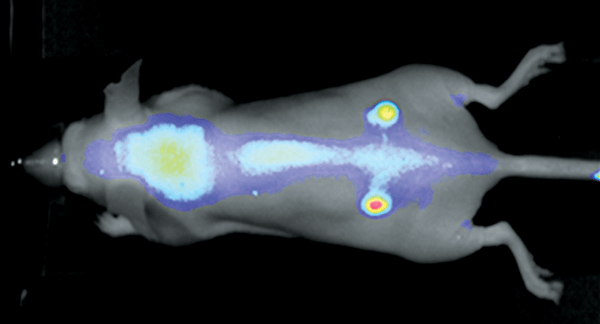
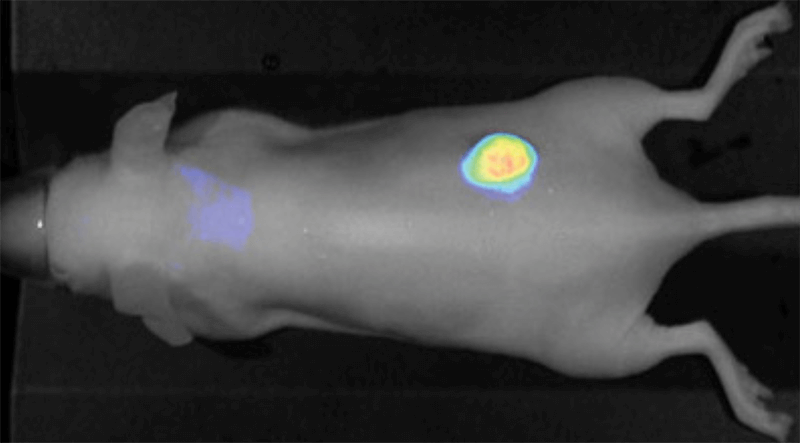
Figure 2. Nude mouse bearing subcutaneous tumors, U87 (left hip) and A431 (right hip), was imaged 24 h post intravenous injection of IRDye 800CW RGD (1 nmole). Image was captured on the Pearl Imager; 800 nm signal is presented in pseudo-color overlaid on a white light image of the mouse. Research conducted at LI-COR Biosciences.
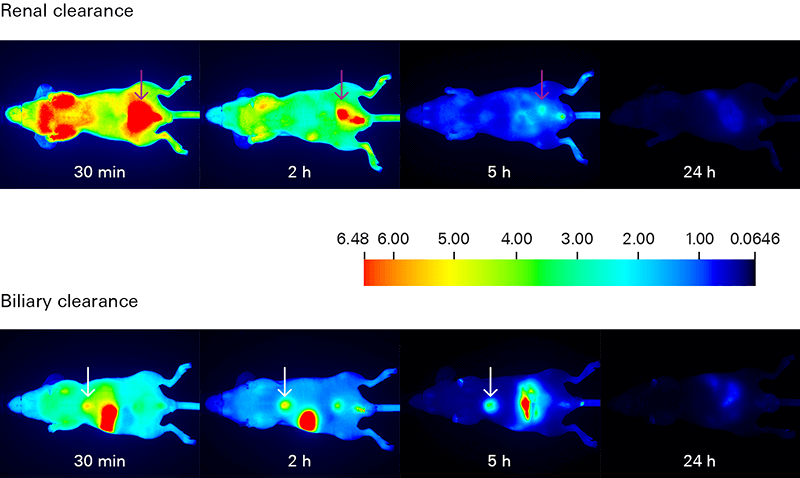
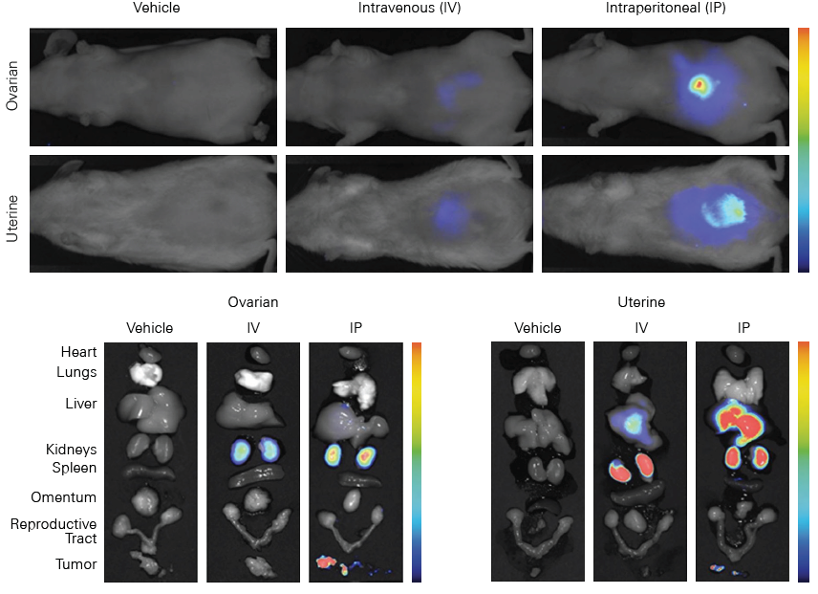
Biodistribution and clearance assessments track the movement of your dye-labeled therapeutic in order to understand its uptake, localization, distribution, and elimination within the animal.
Biodistribution and clearance studies can identify regions and time of specific and non-specific retention of your therapeutic in organs and tissue.
Deep light penetration and minimal autofluorescence from animal tissues make NIR detection ideal for tracking biodistribution and clearance with high sensitivity. Low background yields excellent signal-to-noise ratios for monitoring your dye-labeled therapeutic in vivo and ex vivo.
The Pearl Trilogy Small Animal Imaging System can perform rapid time-lapse in vivo imaging without the need to manually adjust camera settings between scans. For ex vivo analysis, the Organ Tray Base and disposable organ trays provide a non-heated, flat surface for imaging on the Pearl Trilogy system. IRDye Infrared Dyes IRDye 800CW and IRDye 680RD provide excellent performance for in vivo and ex vivo biodistribution and clearance imaging.
The vascular endothelium in the tumor microenvironment is often discontinuous, which allows molecules to diffuse into the surrounding tissue.9, 10 Lymphatic drainage in these regions is also poor.11 As a result, the tumor tissue is permeable to large molecules, and retains these molecules. Because of these properties, tumor vasculature and lymphatics can be studied using in vivo NIR imaging.
IRDye 800CW Infrared Dyes are detected in the NIR spectrum where background autofluorescence from tissues is minimal. As a result, high signal-to-noise ratios are generated and provide images with excellent quality and resolution.
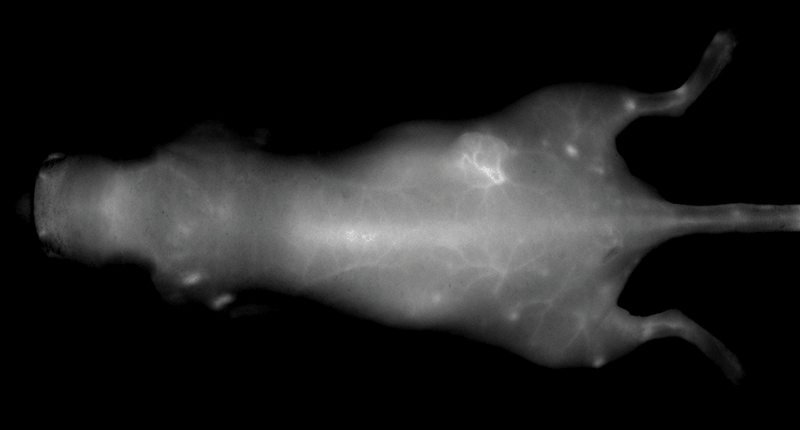
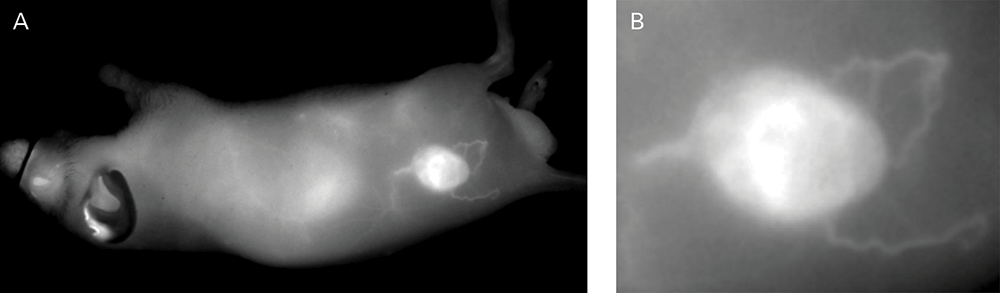
An NIR dye-conjugated contrast agent, such as IRDye 800CW PEG (polyethylene glycol), serves as a non-specific contrast agent for vascular imaging. The labeled agent is administered to mice intravenously (IV injection) and highlights surface vasculature for 30 minutes post-injection (Figure 6). The retention of the agent is visible in the tumor 4 hours post-injection (Figures 7A, B; requires appropriate mouse model*) and the tumor region is defined by 9 hours post-injection (Figure 8).
*Success of vascular imaging depends on the mouse model used. Vessels may be less visible in mice that are obese or have hair.
IRDye 800CW PEG also serves as an effective lymph tracking agent and can be administered by intradermal injection (Figure 9). Other contrast agents labeled with IRDye 800CW have been used in intraoperative identification of lymphatic branches and small sentinel lymph nodes and have outperformed NIR quantum dots.12
The Pearl Trilogy Small Animal Imaging System allows visualization of vasculature and lymphatics, without the need to change exposure settings between scans. Watch this two-minute video on rapid time-lapse lymphatic and lymph node imaging.