Use IRDye Reagents for NIR Fluorescent Microscopy

Microscopy Using IRDye® Infrared Dyes

The benefits of near-infrared imaging, both in vitro and in vivo, have generated intense interest in near-infrared microscopy. Most microscopes are outfitted for detection of visible fluorescent wavelengths and not near-infrared wavelengths, so questions may arise about how to perform microscopy with IRDye near-infrared (NIR) fluorescent dyes.

Although LI-COR does not provide microscopy equipment, we have evaluated the near-infrared detection capabilities of microscopes from several manufacturers, particularly in the ~800 nm wavelength region. We are pleased to provide you with guidelines and recommendations for configuring an Olympus or Zeiss microscope for near-infrared detection. The microscope manufacturer can also offer technical assistance.

Microscopic Evaluations Using IRDye Conjugates and Probes

figure 1
Figure 1. Deconvolved image of A431 cells. pEGFR was detected with appropriate primary antibody and IRDye 800CW Goat anti-Rabbit polyclonal (P/N 926-32211), represented in green. Total ERK was detected with appropriate primary antibody and IRDye 680 Goat anti-Mouse polyclonal (PN 926-32220) represented in red. Cell nuclei were detected with Sytox® Green Nucleic Acid Stain (Invitrogen), represented in blue. Image captured using an Olympus IX71/IX81 microscope.1
figure 2
Figure 2. Deconvolved image of IRDye 800CW RGD peptide binding to A431 (epidermoid carcinoma) cells. Red signal represents IRDye 800CW RGD (P/N 926-09889); green signal represents Sytox Green Nucleic Acid Stain (Invitrogen). Image captured using an Olympus IX71/IX81 microscope.1
figure 3
Figure 3. Deconvolved image of IRDye 800CW RGD peptide binding to A549 (lung carcinoma) cells. Blue signal represents IRDye 800CW RGD (LI-COR Biosciences); green signal represents Sytox Green Nucleic Acid Stain (Invitrogen). Image captured using an Olympus IX71/IX81 microscope.1
figure 4
Figure 4. Deconvolved image of IRDye 800CW EGF binding to an A431 cell. Red represents IRDye 800CW EGF (P/N 926-08446); green represents Sytox Green Nucleic Acid Stain (Invitrogen). Image captured using a Zeiss Axio Imager microscope.2
figure 5
Figure 5. Three-color image of a mitotic cell. NIH 3T3 cells were stained with anti-tubulin primary and IRDye 800 secondary antibody (shown in red), human CREST serum to show kinetochores (Texas Red Dye, green (false color), and Hoechst for chromosomal DNA (blue). Image captured with a Leica DM RXA microscope.3
figure 6
Figure 6. Staining of duplicated centrosomes. Condensed chromosomes are stained with DAPI (blue). The two centrosomes (red dots) are stained with a primary antibody against pericentrin (a centrosomal component) and IRDye 800 secondary antibody. Image captured with a Leica DM RXA microscope.3

Images

  1. Figures 1-3: Olympus IX71/IX81 inverted epifluorescent deconvolution microscope. Outfitted with xenon light source, standard Cy7 filter set used for imaging of IRDye 800CW, and CCD camera with extended spectral range.
  2. Figure 4: Zeiss Axio Imager epifluorescent deconvolution microscope. Outfitted with xenon light source, IRDye 800CW custom filter set from Chroma Technology (EX: HQ760/40x, DC: 790DCXR, EM: HQ830/50m), and CCD camera with extended spectral range.
  3. Figure 5-6: Leica DM RXA epifluorescent deconvolution microscope. Outfitted with xenon light source, IRDye 800 filter set from Chroma Technology (EX: HQ740/35x, DC: 770DCXR, EM: HQ780LP), and Cooke Sensicam CCD camera without extended spectral range (quantum efficiency for IRDye 800 emission ~5-10%). Images courtesy of Mark Winey and Harold Fisk, Dept. of Molecular, Cellular, and Developmental Biology, University of Colorado at Boulder.

Near-Infrared Fluorescence Offers Advantages for Microscopy

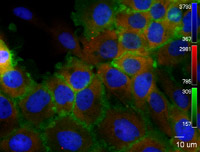
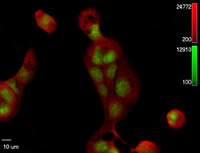
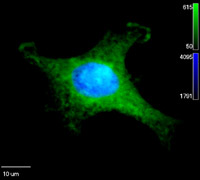
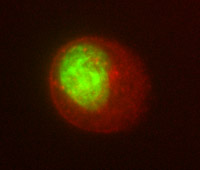
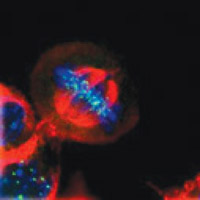
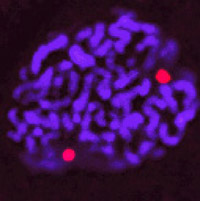
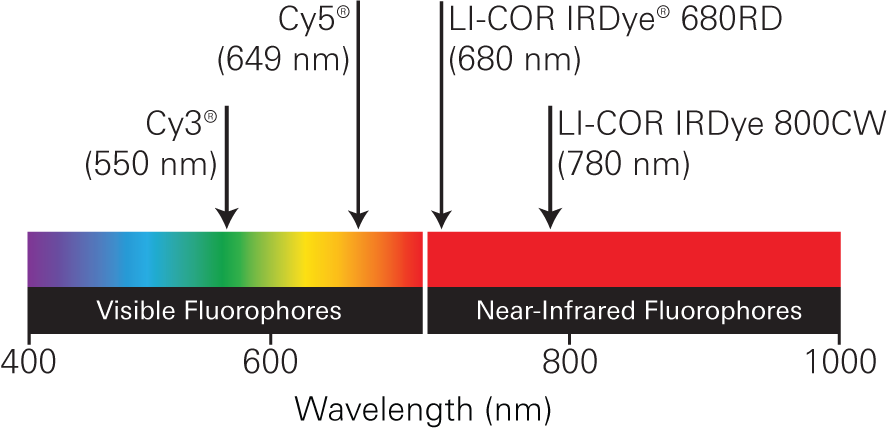
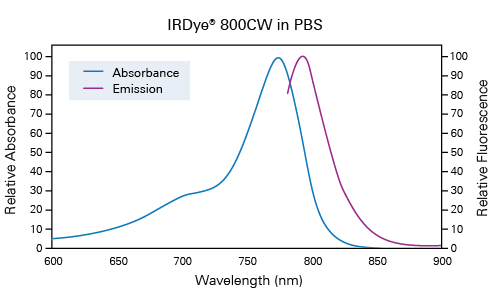
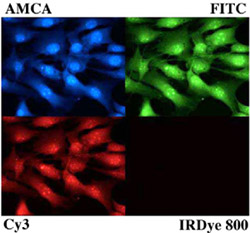
Unlike conventional visible fluorophores, IRDye fluorophores absorb and emit light in the NIR region of the light spectrum. Since most biomolecules have very low autofluorescence in the NIR region, IRDye 800CW Infrared Dye provides a level of performance not available with visible dyes. Emission of IRDye 800CW Infrared Dye is separated by more than 100 nm from most commonly used dyes (Cy5, for example, emits at 670 nm), so there is no risk of spectral overlap or cross-talk between channels. Bright, clear images with extremely clean backgrounds and excellent sensitivity like those shown are typical with LI-COR's IRDye fluorophores.

figure 7

The Infrared Advantage

  • Very low autofluorescence produces images with exceptionally low backgrounds
  • Lower-energy NIR excitation wavelengths cause less sample damage than visible wavelengths
  • NIR dyes have no spectral overlap with visible dyes
  • Multiplex and co-localize without concerns about channel cross-talk or overlap
  • Visualize your NIR dye-labeled agent in cells or tissue sections
figure 8
Figure 8. Spectra graph of IRDye 800CW. The emission maximum of IRDye 800CW Infrared Dye is at 789 nm in aqueous solution.
figure 9
    Exposure Times:
  • AMCA (blue) 5592 msec
  • FITC (green) 4977 msec
  • Cy3 (red) 6007 msec
  • IRDye 800 Infrared Dye 17578 msec
Figure 9. Very low autofluorescence is detected at 800 nm: NIH 3T3 cells were fixed in 0.2% glutaraldehyde. These unstained cells were viewed using standard blue, green, and red filters, plus an IRDye 800 Infrared Dye filter set from Chroma Technology Corp. Glutaraldehyde fixation caused strong autofluorescence in the visible fluorescence channels (blue, green, and red). However, no autofluorescent background could be seen in the IRDye 800 Infrared Dye channel, even with a very long exposure (signal would be shown as red in false color).

Image was captured with Leica DM RXA epifluorescent deconvolution microscope, outfitted as follows: xenon light source, IRDye 800 filter set from Chroma Technology (EX: HQ740/35x, DC: 770DCXR, EM: HQ780LP), and Cooke Sensicam CCD camera without extended spectral range. Image courtesy of Mark Winey and Harold Fisk, University of Colorado at Boulder.