Introduction to the LI-5700A
Welcome, and thank you for your purchase of the LI-5700A Spectrophotometric Seawater pH Analyzer. The LI-5700A measures pH in seawater samples using a colorimetric determination method. If you have just taken delivery of your equipment, inspect the package to be sure you received everything you ordered.
What's what
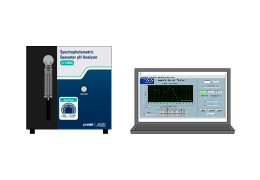
Your package should include the LI-5700A control unit, a Cary 60 spectrophotometer, a water-jacketed flow cell, a computer, and a variety of spares and accessories.

Control unit
Part number 99543-007
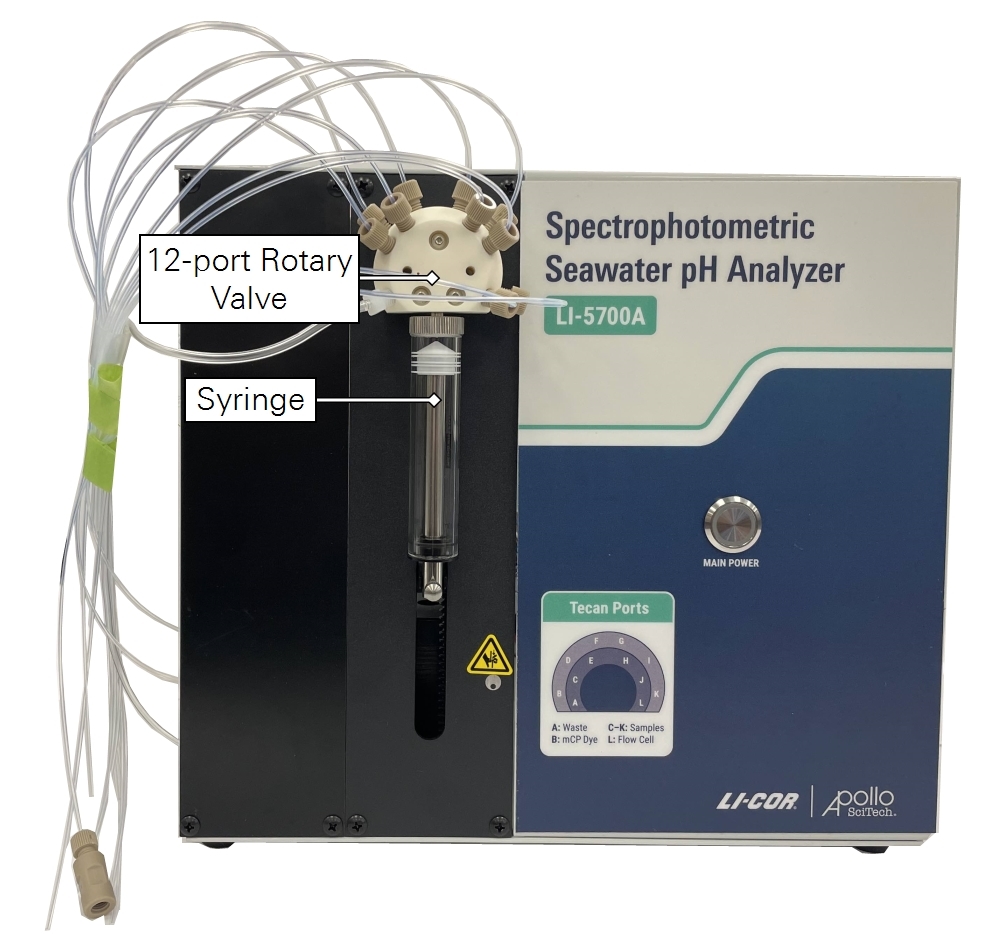
The control unit handles samples and digital communication. The front presents a 12-port rotary valve with tubing attached, a 10-mL syringe pump, and the power button. The syringe and rotary valve are controlled by the computer that is attached to the analyzer.


12-port rotary valve and syringe
The valve and syringe transfer reagent and samples for measurement. Port assignments are described in Rotary valve port assignments.
Serial port
For digital communication between the computer and control unit with the included RS-485-to-USB converter cable.
Temperature sensor connector
Connects the flow cell to the control unit for the flow cell temperature measurement.
Power in
For the power cable, accepts 110 to 240 VAC; 50 or 60 Hz.
Water-jacketed flow cell
Part number 99543-009
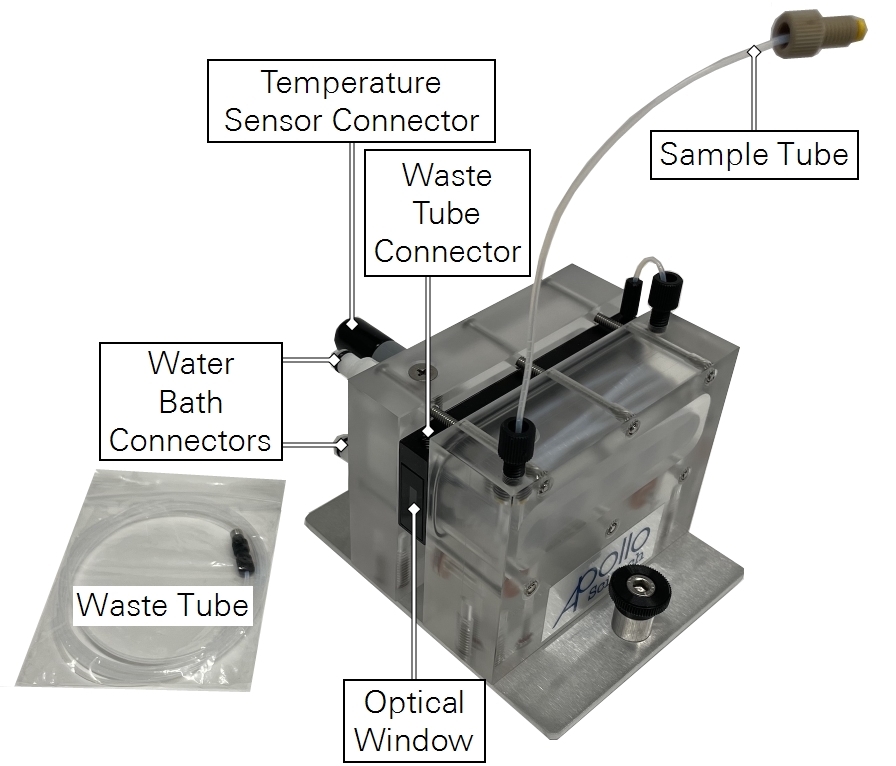
The water-jacketed flow cell will be installed in the Cary 60 Spectrophotometer (see Installing the flow cell in the Cary 60). It contains the sample and enables temperature control with a user-supplied water bath during each optical scan. The flow cell has a built-in temperature sensor that provides temperature measurements to the LI-5700A during a measurement, along with connectors for the water bath. A waste tube with connector is included with the flow cell.
The flow cell features an internal coil of PTFE tubing (0.8 mm OD), which is to bring the sample temperature quickly to the water bath temperature. The inlet tube of this flow cell is connected to the temperature-controlled coil. The sample temperature is controlled by connecting water jacket to a temperature-controlled water bath.
Caution: The flow cell has two quartz optical windows. Remove the protective covers before use. Handle the flow cell carefully - do not damage or touch the surface of the optical window. Use Kimtech™ Science Kimwipes® to clean the window if needed.
Computer with software
Part number 616-21277
A Dell™ Latitude™ 3450 laptop computer running Windows® 11. Includes a universal power supply and battery. The computer is equipped with a licensed version of the software required by the instruments, and should be dedicated to the control and operation of the device.
pH indicator dye
Part number 826-21360
A quantity of indicator grade 90% dye content m-Cresol Purple (mCP) is included with the shipment.
Warning: m-Cresol Purple (mCP) can cause skin and eye irritation, and it may irritate the respiratory system. Wear gloves, eye protection, and protective clothing when working with mCP. Wash skin with water if in contact with mCP. Rinse eyes thoroughly with water and contact a poison control center if it gets into your eyes.
Spares and accessories kit
Part number 99543-010
Each LI-5700A includes a kit with spare parts and accessories.
| Description | Part Number |
|---|---|
| Universal Power Supply (100 to 240 VAC, 50 or 60 Hz input; 24 VDC output) | 591-17947 |
| Cali-5-bond bag with valve and tubing for pH indicator | 841-21100 |
| Water jacket tubing with quick-connects (2) | - |
| Latex tubing | 222-21110 |
| Tube fittings | 300-21380 |
| Flow cell temperature sensor cable | 392-21693 |
| USB-to-RS-485 converter cable | 590-21298 |
| Power Supply (24V; 220W; 9.2 A) | 591-17947 |
| USB 3.0 4-port Hub | 616-21333 |
Power cable options
Your system will include a power cable with one of the following adapters:
| Description | Part Number |
|---|---|
| For USA, Canada, Mexico, and Japan; NEMA 5-15; Type B | 390-00787 |
| For Europe, South America, and Asia; CEE 7/7; Type C | 390-01486 |
| For United Kingdom; Type G | 390-03089 |
| For Israel; SI32; Type H | 390-03059 |
| For Australia; Type I | 390-03095 |
Cary 60 UV-VIS Spectrophotometer
Part number 294-21359
The Cary 60 UV-Vis is a simple, powerful spectrophotometer capable of quickly acquiring high-resolution spectral data from 190 to 1100 nanometers.
Cary 60 documents pack
Included in the box with the Cary 60 Spectrophotometer, the documents pack identifies the serial number of the Cary 60. It also includes some regulatory compliance information and a hex key for service described in the Cary 60 manual.
Cary 60 accessories and components
These accessories are for use with the Cary 60. It includes the user guide, software kit, power cable, and power transformer.
Microcell assembly
The microcell assembly is used to contain micro-samples. This part is included with the Cary 60, but not required for the spectrophotometric pH application.
User supplied components
Some materials, chemicals, and lab equipment are required to use the LI-5700A.
Deionized water
Deionized (DI) water is needed to prepare the indicator.
NaOH and HCl
Sodium hydroxide is needed to prepare the indicator. Hydrochloric acid may be needed for some protocols.
Water bath
A temperature-controlled water bath that is able to supply water at a temperature that is similar to the room temperature (~22 °C).
Ring stand with clamp holder
A metal stand with gripping attachment to hold the pH indicator bag.
Sample containers
Containers to hold samples during a measurement sequence.
Waste solution container
The system will discharge waste from port A on the rotary valve and from the flow cell after measurement. A 5-liter plastic bottle or bucket is suitable, or you can discharge the flow cell into a sink, in which case, a smaller waste container can be used to collect the waste from the 12-way valve. See Waste collection container.
Cuvette cleaning supplies
A commercial cuvette cleaning solution may be needed to thoroughly clean the cuvetted flow cell. Kimwipes® are used to clean the windows of the flow cell. A syringe is used to transfer the cleaning solution to the cuvette.
pH measurement principle
This analyzer has been developed for high precision and accuracy, automated and fast determination of seawater pH. It is based on the principle of colorimetric determination of the relative color intensity using a pH indicator (m-Cresol Purple; mCP) at three wavelengths (434 nm, 578 nm, and 705 nm) with the first two absorptions as a known function of pH and the third one serves as a baseline correction. The automated analyzer is designed according to Carter et al. (2013), with improvements. The calculation procedure is based on Liu et al. (2011) and Müller and Rehder (2018). A Cary 60 spectrophotometer is used for the colorimetric determination with high precision.
Seawater pH has been measured as a valuable routine chemical parameter. It reflects the thermodynamic state of all acid-base systems, particularly the carbon dioxide system, which is influenced by physical, chemical, and biological processes in the ocean. In recent years, it is further recognized that the dissolution of the ever-increasing CO2 in the atmosphere into the ocean has acidified seawater and reduced seawater pH. This process known popularly as ocean acidification may seriously affect the health of marine calcifying organisms and the ecosystem and alter ocean biogeochemical processes, making pH a more important parameter. However, the precision and accuracy of pH measurement must reach certain level to evaluate those processes that influence the equilibrium point in the ocean carbon dioxide system, gas exchange, biological uptake/regeneration, and mixing. Especially in seawater and estuarine waters, traditional electrometric pH measurement is subject to errors (uncertainty > 0.01 – 0.1 pH units). In addition, pH analysis should be accomplished within hours of obtaining water samples to avoid changes during sample storage, adding much labor intensity during fieldwork. Thus, a precise and automated method and device is very much desired. The LI-5700A is designed and built to meet this need.
This spectrophotometric pH measurement approach involves the use of pH-sensitive indicator dyes together with the high-quality Cary 60 spectrophotometer. The sulfonephthalein indicators (H2I), e.g., mCP, exist in three forms including H2I, HI-, and I2-. The reaction of interest at seawater pH is the second dissociation:
HI-(aq) ↔ H+ (aq) + I2-(aq)
The indicator being present at a low level in a seawater sample. The total hydrogen ion concentration of the sample can then be determined:
pH = −log([H+]) = pK2 + log([I2−]/[HI−])
The principle of this approach is that the different forms of the indicator have substantially different absorption spectra. Thus, the information contained in the composite spectrum can be used to estimate [I2−]/[HI−]. Two wavelengths are used to give the concentration ratio. The optimal choice of wavelengths corresponds to using the absorbance maxima of the acid and base forms respectively; this choice is at once the most sensitive as well as being forgiving of minor deviations in wavelength reproducibility.
The simplest way to obtain the equilibrium constant K2 is to add a small amount of indicator to a standard pH buffer (a TRIS buffer solution), i.e., one for which values of p[H+] are known based on previous equations. Then, pK2 for the indicator can also be estimated. Using pure mCP, seawater pH on the total hydrogen ion concentration scale (pHT) can be expressed in terms of measured mCP absorbance ratios (R = λ2A/λ1A) as follows (Liu et al., 2011):
1‑1
where
a = −246.64209 + 0.315971 × S + 2.8855 × 10⁻⁴ × S2
b = 7229.23864 − 7.098137 × S − 0.057034 × S2
c = 44.493382 − 0.052711 × S
d = 0.0781344
And mCP molar absorbance ratios are expressed as:
e1 = −0.007762 + 4.5174 × 10⁻⁵T
e3 / e2 = −0.020813 − 2.60262 × 10⁻⁴T + 1.0436 × 10⁻⁴(S − 35)
The mCP absorbances, λ2A and λ1A, used to calculated R are measured at wavelengths (λ) of 434 and 578 nm. This characterization is appropriate for 278.15 K ≤ T ≤ 308.15 K and 20 ≤ S ≤ 40.
Müller and Rehder (2018) have extended the spec-pH analysis to low salinity waters (salinity to 5). They use the following equation for , but same equations for e1 and e3/e2 as in Liu et al. (2011).
1‑2
a = 1080.71477 − 0.135394946 × S0.5 − 198.063716 × S1.5 + 63.1924397 × S2 − 5.18141866 × S2.5
b = −26645.7425 + 5087.96578 × S1.5 − 1624.54827 × S2 + 133.276788 × S2.5
c = −189.671212 + 34.9038762 × S1.5 − 11.1336508 × S2 + 0.912761930 × S2.5
d = 0.327430677 − 0.000751448528 × S0.5 + 0.000394838229 × S − 0.0600237876 × S1.5 + 0.0190997693 × S2 − 0.00156396488 × S2.5
Equations by Douglas and Byrne (2017) and Mosley et al. (2014) are also available in the program.
One limitation of the approach is that when one adds an indicator dye to a seawater sample it is possible to change the pH of the sample. This perturbation is usually corrected by a double dye addition approach. The software program has a double dye addition measurement that allows the user to correct the dye impact on pH by extrapolating to zero dye condition. See Clayton and Byrne (1993) and Carter et al. (2013).
In general, the perturbation correction should be < 0.005 pH units. When the double dye correction exceeds 0.005, it generally indicates that the mCP volume and/or concentration used are too high.
Summary of the analysis sequence
The automated analysis sequence follows a series of prescribed steps. To begin, the LI-5700A control unit will flush the sample tubing, syringe, and spectrophotometric flow cell with the sample (about twice the sample volume).
Next, the control unit will fill the flow cell with the sample (4 – 6 mL) as the analytical blank. If the sample salinity (density) difference is large, you can select a larger blank volume (≤ sample volume).
While waiting 10 seconds to allow seawater in the cell to stabilize and further reach the set temperature, the control unit will fill the syringe with half of the sample volume, add the pH indicator, and then continue to rapidly fill the syringe with more sample, causing the pH indicator to mix with the sample. A user-configurable post-dye mixing time is allowed.
Next, the control unit and Cary 60 will measure the seawater in the cell (without the pH indicator) as blank.
Finally, the control unit will replace the seawater in the flow cell with the seawater and pH indicator mixture, wait 10 – 30 seconds to allow the mixture to stabilize and to reach the temperature, and then record the spectrophotometric pH measurements.
References
| 1 | Carter, B.R., Radich, J.A., Doyle, H.L. and Dickson, A.G. (2013). An automated system for spectrophotometric seawater pH measurements. Limnology and Oceanography: Methods, 11(1), pp. 16–27. doi:https://doi.org/10.4319/lom.2013.11.16. |
| 2 | Clayton, T.D. and Byrne, R.H. (1993). Spectrophotometric seawater pH measurements: total hydrogen ion concentration scale calibration of m-Cresol Purple and at-sea results. Deep Sea Research Part I: Oceanographic Research Papers, 40(10), pp. 2115–2129. doi:https://doi.org/10.1016/0967-0637(93)90048-8. |
| 3 | Douglas, N.K. and Byrne, R.H. (2017). Spectrophotometric pH measurements from river to sea: Calibration of mCP for 0 ≤S≤ 40 and 278.15 ≤T≤ 308.15 K. Marine Chemistry, 197, pp. 64–69. doi:https://doi.org/10.1016/j.marchem.2017.10.001. |
| 4 | Liu, X., Patsavas, M.C. and Byrne, R.H. (2011). Purification and Characterization of meta-Cresol Purple for Spectrophotometric Seawater pH Measurements. Environmental Science & Technology, 45(11), pp.4862–4868. doi:https://doi.org/10.1021/es200665d. |
| 5 | Mosley, L.M., Husheer, S.L.G. and Hunter, K.A. (2004). Spectrophotometric pH measurement in estuaries using thymol blue and m-Cresol Purple. Marine Chemistry, 91(1-4), pp.175–186. doi:https://doi.org/10.1016/j.marchem.2004.06.008. |
| 6 | Müller, J.D. and Rehder, G. (2018). Metrology of pH Measurements in Brackish Waters—Part 2: Experimental Characterization of Purified meta-Cresol Purple for Spectrophotometric pHT Measurements. Frontiers in Marine Science, 5. doi:https://doi.org/10.3389/fmars.2018.00177. |

