Preparing for measurements
During every measurement cycle, waste solution from the reactor is discharged both at the end of an analysis and the beginning of the next analysis. If it fails to discharge, stop the program and check for waste discharge problems such as blockages in the tubing. Do not continue the analysis until the problem is solved.
Tips for success
Below we offer some general suggestions that you should consider as you develop a measurement protocol.
Filter the sample
Filter the water samples to remove any suspended solids.
Fill tubes before measurements
Before the measurements, if the standard or sample tubes are not filled with seawater (or a solution with similar densities as the samples to analyze), put all standard and sample tubes in seawater, use the function Clean Valve (x1) to fill the tubes with seawater or a solution with an appropriate density. This minimizes the mixture between acid and sample when cleaning the tubes and helps improve the precision of the measurement.
Allow time for the system to stabilize
Run aged seawater or a solution with DIC similar to your samples for 30 minutes to 1 hour (three to six samples) for the analyzer to stabilize before the analyses of the standard and samples.
Measure the standards
Measure a set of standards at the beginning and the end of analysis (or a day), as well as every six to eight samples; the current default setting for batch analysis is a set of standards for every eight samples. Then do the calculation in a spreadsheet program. This is convenient for a few reasons. As the instrument drifts slightly with time, you cannot apply the same standard curve over a day. Also, you have to convert molarity (concentration in the unit µmol/l) to molality (concentration in the unit µmol/kg) using the sample’s salinity and temperature at measurement.
You can choose to run three volumes of the standard (0.7, 0.8, and 0.9 mL or 1.2, 1.5, and 1.8 mL) in the beginning, run eight samples, and run another three volumes of standards again at the end.
Maintain the CRM standards
We recommend that you keep the CRM standard in a gas-tight Cali-5-Bond bag during measurements.
Watch for air bubbles
Air bubbles may form inside the sample syringe on top of the plunger. Small air bubbles of < 1 mm in size are generally not a problem as they stay stable most time. If there are large bubbles (3 – 4 mm), this is often the reason for noise in the data, as bubbles change in size with time and room temperature. First, see if the syringe is loose where it connects to the valve. Tighten it by turning the syringe clockwise with two fingers. Do not overtighten it with tools. If the syringe is tight, check if the tube connectors for acid and samples are tight. Use fingers to tighten them; do not overtighten them with tools.
One effective way to eliminate air bubbles inside the syringe is to use the Purge function (see Utilities). When activating Purge, lift the tube from the acid solution so that it draws air into the syringe. Once the syringe moves about 25% of its volume, put the tube back into the liquid. The air space and the subsequent waterfall created this way will eliminate the air bubbles. If large air bubbles persist, then a leak in one of the connectors is the likely reason.
Air bubbles may also form even if there is no leakage. This problem of bubble formation occurs most during winter with river/estuarine samples (cold and fresh water is rich in dissolved air) when they are brought inside a warm room. One option is to put bottles of samples and standard in cold water jackets.
Control temperatures
Keep the acid bottle, the standard bottle or bag, and the sample bottles or vials in temperature-controlled water bath or water jackets and set the bath temperature to a constant value, 2 to 5 °C lower than the room temperature. Knowing the exact sample temperature will also help you in converting molarity (µmol/l) to molality (µmol/kg). Operating the equipment in a room with a very stable temperature will also help achieve the highest analytical precision.
Warming up
Your system should be powered on at least 10 minutes before measurements or until the condensation temperature display on the front panel shows the temperature is stable at 2 to 3 °C.
On the tank of carrier gas, open the two-stage regulator and adjust the valves to an output pressure of 16 to 18 psi (110 to 124 kPa). If the regulator’s main control has a small leak, it may exert too much pressure to the secondary control and to the instrument. In that case, relieve the air pressure first.
LI-5300A with LI-7815 and LI-5370A with LI-7825
Turn the Trace Gas Analyzer on and wait for it to warm up to 55 °C. This might take more than 1 hour if the analyzer is at room temperature. When it is ready, its screen should display Measuring. Refer to its own instruction manual if it takes excessively long to be ready. Do not power on the LI-7815 or LI-7825 analyzer with a 0 ppm CO2 gas flowing through because it will not initialize properly.
LI-5350A with LI-850
The LI-5350A module has one switch for the DIC module and one for the LI-850. These can be turned on separately in any order. After powering on the LI-850, allow it to warm up for at least 5 minutes, or until the LI-850 passes its self-test and the optical bench reaches the target of 50.1 °C.
Preparing the acid solution
Use a 3% H3PO4 plus 7% NaCl solution (neither concentration needs to be precise) to convert all dissolved inorganic carbon to free CO2. In a 2.5-liter reagent bottle:
- Add around 0.5 liters of DI water and 175 g of NaCl and shake it to mix the solution.
- Add 89 mL of 85% concentrated H3PO4 to the mixture.
- Add DI water to the 2.5-liter line and shake it until NaCl completely dissolves and the solution is well mixed.
It is possible to lower the concentration of H3PO4, especially if your samples have DIC values lower than that of typical seawater; please consult LI-COR.
Connecting tubes for acid, standards, samples, and waste
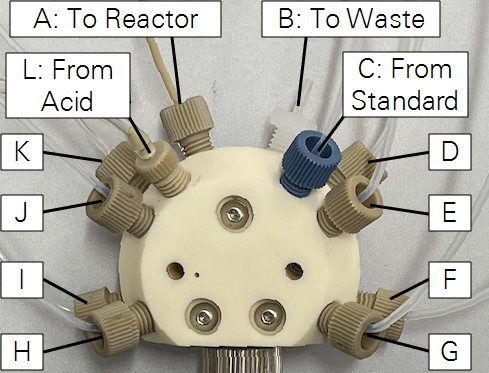
Tubes for the reactor, standard, samples and acid are installed at the factory. You will install a piece of 1/8” OD Tygon® tubing (part number 222-21112 from the spares kit) from port B on the DIC module to the waste container.
| Port | Purpose | Tube |
|---|---|---|
| A | To Reactor (connected) | 1/16” OD (0.04” ID) PEEK |
| B | To Waste Collector | 1/8” OD Tygon (222-21112) |
| C | From Standard | 1/16" OD PTFE (222-21111) |
| D, E, F, G, H, I, J, K | From Samples | 1/16" OD PTFE (222-21111) |
| L | From Acid | 1/8” OD Tygon (222-21112) |
-
Set the bottle of acid solution to the left of the DIC module.
-
Install the acid tube.
One end is connected to port L. Place the other end into the acid solution. The end of the tube should be completely submerged into the acid solution.
-
Install the waste tube.
Cut the waste tube to a suitable length to reach between the DIC module and the waste container. Connect one end to port B and place the other end in the waste container. Keep the end from being submerged in the waste.
-
Install the standard tube.
Place the other end of the port C tube into the standard. The inlet of each tube should be well below the surface of the liquid to minimize the effect of CO2 loss to the air.
-
Prepare to place the sample tubes in the sample containers.
Initial configuration
The initial configuration establishes that devices are communicating and performing as expected.
Applying the general settings
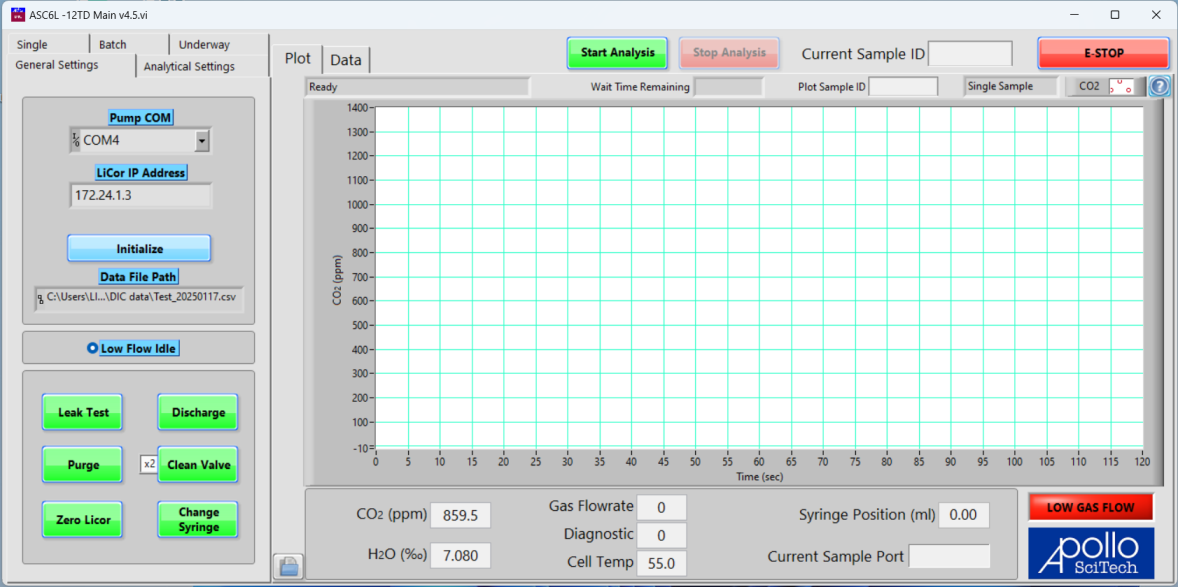
Start by setting up the DIC module, computer, and gas analyzer, as described in Installing the DIC system. To configure the settings, start the DIC analytical program on the computer.
Note: If the interface does not fit on the screen, adjust the display settings. Press the Windows key ( ), type display, and press Enter. In Display settings, change Scale and Layout to either 125% or 100%.
-
In the software, set the COM port for the DIC module pump.
To find the serial port number, open the Device Manager (press the Windows key
, type Device Manager, then press Enter). Click Ports (COM & LPT). Look for USB Serial Port (COM#). The serial port numbers are shown beside the ports. -
Connect with the gas analyzer.
- For the LI-5350A (built-in LI-850), set the COM port that hosts the gas analyzer.
- For the LI-5300A (external LI-7815) or LI-5370A (external LI-7825), enter the IP address given on the display of the gas analyzer.
-
Click Initialize to test the connection between the computer and DIC module.
-
Select a data file.
You'll be prompted to add new measurements to an existing data file or create a new one. The directory for the data file is displayed under the button.
Now, the Utility buttons, Start button, and Ready indicator should be active. Wait Time should be blank, indicating readiness. Meanwhile, CO2 (ppm), H2O (‰), and carrier gas flow rate (mL/min) are displayed. The LI-5300A also gives the LI-7815 diagnostic code (0 is normal operation) and cell temperature.
Low Flow Idle is on by default. When in an idle state for more than 10 seconds, the DIC module lowers the flow rate from the normal working rate to 50 mL/min.
If the gas flow rate is lower than the setting for more than 10 seconds, the program will play an audible alarm, abort the current measurement, and bring the DIC module to an idle state.
Setting the syringe pump Home position
The home position of the syringe is set automatically when it is initialized. However, if there is liquid in the syringe or the outlet tube is restricted during initialization, the system may not correctly identify the home position. To correct this, be sure that liquid can flow freely out of the syringe when the plunger moves, and initialize the syringe again. Repeat the initialization multiple times, if necessary, until the syringe is free of liquid and can identify the correct home position.
Configuring analytical settings
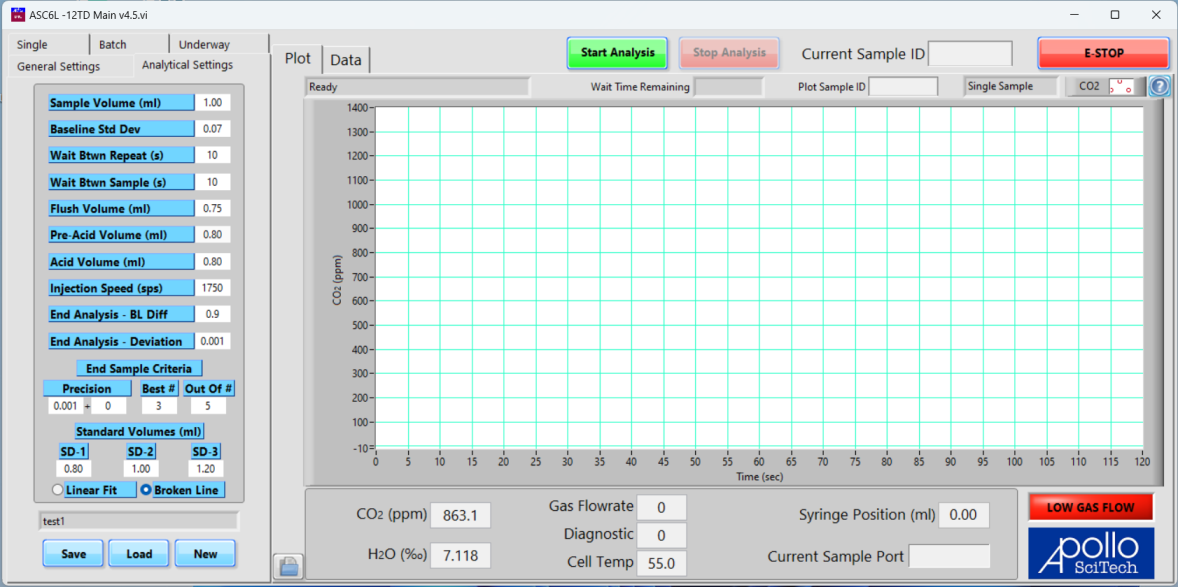
The options available under Analytical Settings differ slightly between the LI-5300A, LI-5350A, and LI-5370A. Differences are clearly described in the following section. Analytical Settings are changed by entering a new value — changes take effect immediately after taking the focus away from the text box by clicking elsewhere.
- Reference Standard (LI-5370A only): For measurements of CO2 isotopes by the LI-7825, enter the standard.
Default is the Vienna Pee-Dee Belemnite standard = 0.0112372. - Sample Volume (mL): Volume of sample to be drawn for Batch and Underway analyses (Single analysis has its own volume setting).
The sum of the sample volume and the acid volume cannot exceed the syringe size. - Baseline Std Dev (LI-5300A and LI-5370A): Maximum standard deviation for the CO2 reading before starting sample injection. For example, 0.12 means baseline CO2 readings should reach a standard deviation of <0.12 ppm before the sample is injected for analysis.
Recommended value = 0.07 – 0.12. - Wait Btwn Repeat (s): Seconds to wait before starting the next analysis of the same sample. During this time, the carrier gas flows to the CO2 analyzer, which helps stabilize the baseline reading for the next measurement.
Recommended value = 10. - Wait Btwn Sample (s): Seconds the program waits before starting the analysis of the next sample. During this time, the carrier gas flows to the CO2 analyzer, which helps stabilize the baseline reading for the next measurement.
Recommended value = 1 – 10. - Flush Volume (mL): At the beginning of each new sample, the DIC module draws acid for the specified Acid Volume two lines under this item, draws sample according to Flush Volume and injects all the sample and acid to waste.
The flush volume cannot exceed the difference between syringe size and acid volume. - Pre- Acid Volume (mL): Volume of acid that is needed before injecting the sample to the reactor. When this portion of the acid is in the reactor, carrier gas is bubbled through it to measure CO2 until a steady baseline is achieved.
- Acid Volume (mL): Volume of acid needed to clean sample tubing and the volume of acid needed for the reaction with the sample, which sits on top of the plunger and underneath the sample in the syringe.
The sum of the acid volume and any sample or standard volume or flush volume cannot exceed the syringe size (see Sample Volume (mL) above and Standard Volumes below). - Injection Speed (sps): The number of steps that the pump moves per second (sps). The full length consists of 48,000 steps. This parameter should remain constant for any batch of standards and sample, but you may experiment with different speeds to fine tune the analysis to better suit the samples. Lower speeds (1200 sps) may be preferable for smaller sample volumes (1.0 mL).
- End Analysis - BL Diff: Criterion for success. Once the average of 10 readings falls between the Baseline and Baseline+BL Diff, the measurement is deemed successful and the result is recorded. Normally, a difference of 0.7 ppm between the final baseline and the initial baseline is good enough. If BL Diff = 0.7 is selected, then the next alternative value is to set a lower value, e.g., 0.001, so that it will not be triggered. For the LI-5370A, you can set criteria for both CO2 and d13C.
- d13C Regression Standard (LI-5370A only): The d13C value to use for correction. This value represents the standard from the seawater sample.
- End Analysis - Deviation: Criterion for success based on standard deviation. Once the standard deviation of 10 readings falls within the specified standard deviation value (e.g., 0.06 ppm), the measurement is deemed successful and the result is recorded. When either BL Diff or Deviation is met, the measurement will be deemed finished.
We recommend 0.1 as the termination condition. Once this mode is chosen, set the End Analysis - BL Diff to 0.1 so it will not be triggered. You can also use a higher value of 0.12 – 0.15 to save time or a lower value of 0.05 for a more stringent condition. - End Sample Criteria: Determines when a sample is considered finished.
The Relative Standard Deviation (RSD) computed from values in the Best # box needs to be ≤Precision. Normally we use 0.001, which is ±0.1% or about ±2 µmol/kg in normal seawater. In some cases, you can loosen the acceptable condition by entering a larger value. For example, for river water samples with DIC < 500 µmol/kg, it may be too challenging and not necessary to get ±0.1% (or about ±0.5 µmol/kg), in which case, ±0.3% may be acceptable. The LI-5370A with LI-7820 provides precision options for total DIC and δC-13.
The second number in Precision provides some flexibility in accepting a larger than desired RSD to avoid a second attempt when it reaches the maximum number of repeats.
With a precision 0.001 ± 0.0002 and best 3 out of 5, if the RSD of the first 3 repeats is within 0.1%, they are labeled Valid, and it proceeds to the next sample. If the RSD of the first 3 repeats is over 0.1%, it runs a fourth repeat.
Then, if best 3 repeats yield an RSD within 0.1%, they are labeled Valid and the other one Excluded, and it proceeds to the next sample; otherwise, it runs a fifth repeat.
Then, if the best 3 repeats yield an RSD within 0.1%, they are labeled Valid and the other two Excluded.
If the best 3 repeats yield an RSD over 0.1% but within 0.12%, they are labeled Within Tolerance and the other two Excluded.
If the best 3 repeats yield an RSD over 0.12%, all 5 repeats are labeled Failed and it makes a second attempt on the same sample. This may be useful for work on incubation samples, in which case you may want to repeat the sample a few times for better precision but understand that there may be a change in the sample composition large enough within the time frame of three to five repeats.
Best #: Specifies how many measurements are needed when calculating the RSD of the measured integration areas of these measurements.
Out of #: Specifies how many measurements in total are allowed in each attempt, before the program does a second attempt on the same sample or stop itself and alert the user about the condition.
Both Best # and Out of # are limited to integers between 1 and 15 and Best # is less than or equal to Out of #. If you attempt to enter a number that does not meet these criteria, the number closest to your attempted input that meets the criteria will be recorded. When the ratio of Best # to Out of # (Best #/Out of #) is less than 0.6, the Best # numbers of measurements need to be consecutive when calculating the RSD and comparing to the Precision. For example, in the mode 2 out of 5 (refer to as mode 2/5), when any 2 consecutive measurements yield an RSD within 0.001, the current sample is completed, and the next will be started. When the ratio is greater than or equal to 0.6, the Best # numbers of measurement do not need to be consecutive. In the more common mode, 3/5, when any 3 out of a maximum of 5 measurements yield an RSD within 0.001, the current sample is completed.
- Standard Volumes: Volumes of standards. SD-1, SD-2, and SD-3 are the volumes for the CRM or secondary standard. Generally, three volumes (e.g., 1.2, 1.5, and 1.8 mL) are recommended to create a calibration line. You can use one standard but with different volumes to create a calibration line. Note this is meant to correct the small amount of CO2 in the acid and carried over from the previous analysis. Lower volumes (e.g., 0.5, 0.75, and 1.0 mL) may be preferred for high DIC porewater samples. You should estimate the DIC of the unknown sample and choose sample and standard volumes so that the total carbon (and the integration area) of the sample falls within the range of the three standard volumes. The sum of the acid volume and any standard volume cannot exceed the syringe size.
- Choose either linear fit or broken line to generate the integration area-standard volume relationship. The broken line method uses two adjacent standard volumes to interpolate and extrapolate.