Taking measurements
Three modes are supported: Single, Batch, and Underway. Single analysis is recommended for testing and learning purposes. Batch analysis is recommended for discrete samples and standards (see Batch sample analysis). Underway analysis is useful when you have access to a water line on a ship or dock (see Underway sample analysis). Regardless of the mode, you'll begin by configuring General Settings (see Applying the general settings) and Analytical Settings (see Configuring analytical settings), and then configuring the measurement mode, described below.
Single sample analysis
Study this section until you understand how to take the measurements and operate the equipment, and then move on to Batch sample analysis or Underway sample analysis for real data collection.
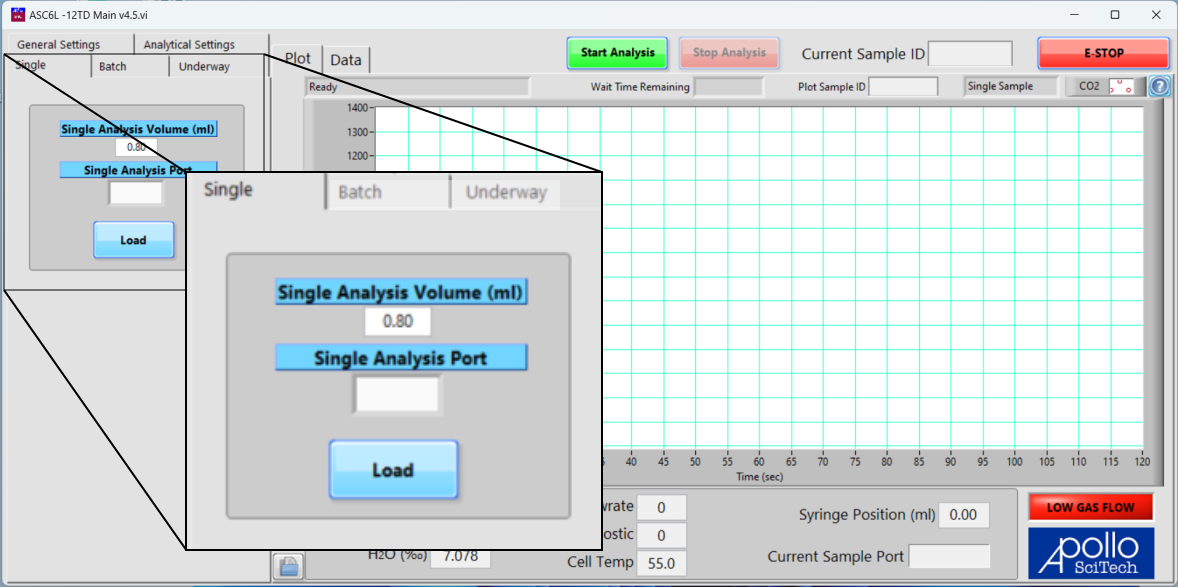
In the Single tab, enter the sample volume and sample port from which you would like to run the analysis. The sum of the sample volume and the acid volume cannot exceed the syringe size.
Standardizing a measurement
All of the standardization procedures are automated when using the batch or underway procedure. This section describes how to calculate sample DIC against a standard using linear fit. You can automate these calculations for a single sample using the batch method and a batch size of 0. But, follow these steps to standardize the measurement manually.
-
Connect a standard solution of known DIC concentration to port C.
-
Create the standard line in a spreadsheet and calculate the final sample DIC.
You may run the standard as a sample, using different volumes of a primary standard you purchased or a secondary standard you prepared. We recommend measuring three different volumes for the standardization. Solution volumes between 0.5 and 4 mL are suitable, depending on the expected DIC range of your samples. Repeat the standard measurements several times for each volume. Record the volume of the standard added and the CO2 integration area.
-
Use linear regression to determine the relationship between integration area and the DIC content by converting each volume of standard solution into DIC content.
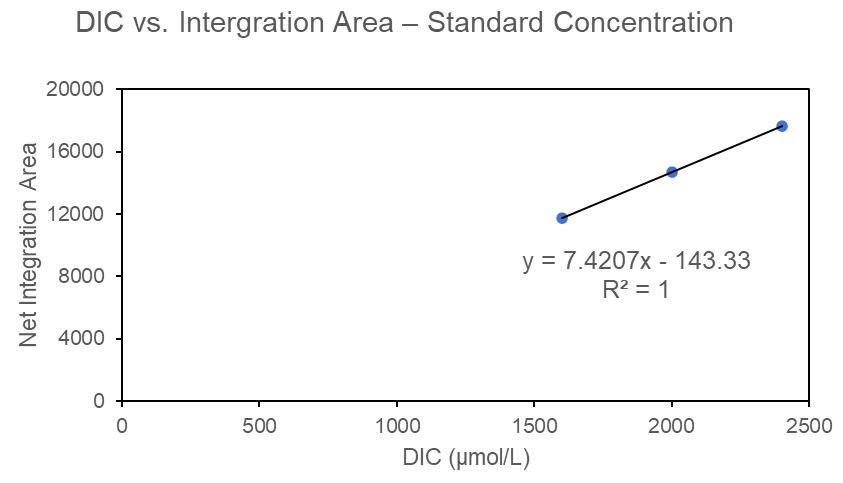
For example, if the standard solution DIC = 2000.0 µM, then 1.0 mL is equivalent to 2.0 µmol of DIC (2000 µM × 0.001 liter) and 0.5 mL is equivalent to 1.0 µmol of DIC (2000 µM × 0.0005 liter). As 1.0 mL is equivalent to a DIC concentration of 2000.0 µmol and 0.5 mL is equivalent to 1000.0 µmol if they are scaled to a total volume of 1 liter, you can make the linear regression equation directly to this unit (µmol/l or µM). Thus, if your sample volume is 1.0 mL, a direct inverse of the regression equation will give you the concentration of your sample (in µM). If your sample volume is 0.5 mL, multiply by a a factor of two. This can be performed conveniently with a spreadsheet program (see Figure 4‑1).
Example calculations
The regression equation used to find area is:
4‑1A = 7.4207 × DIC – 143
where A is the integration area and DIC is the DIC value before any correction for volume.
0.8 mL volume
The volume correction factor for 0.8 mL is calculated with a sample volume (V) of 0.8 mL and an integration area (A) of 10730.
Re-arranging and solving for DIC gives:
DIC = (10730 + 143) / 7.4207 = 1465 μmol/l
Volume correction factor:
DIC / (V / 1 mL) =
4‑21465 µmol/l / (0.8 mL / 1 mL) = 1832 μmol/l
1.0 mL volume
The volume correction factor for 1 mL is calculated with a sample volume (V) of 1.0 mL and an integration area (A) of 12624.
Re-arranging and solving for DIC gives:
DIC = (12642 +143) / 7.4207 = 1720 μmol/l
Volume correction factor:
4‑31720 µmol/l / (1 mL / 1 mL) = 1720 μmol/l
This line can be extended to DIC range below or above its range. For very low DIC freshwater samples, a small volume (0.2 mL) of the Dickson CRM or a dilute secondary standard may be used. For high DIC (> 5 mM) sediment, porewater, or groundwater samples, you may prefer to prepare custom DIC standards. Such a standard may be prepared from reagent grade Na2CO3 after baking at 285 °C for two hours. Or a NaHCO3 solution can be prepared and standardized against the CRM. Aged open seawater may also be used as a standard. Any self-prepared DIC standard solutions should be standardized against the CRM.
-
Prepare sample materials, CRM, and the acid (see Preparing for measurements).
-
Connect the sample tube to a port, as shown in Figure 4‑2.

Figure 4‑2. For a single measurement, the sample vessel is connected to the system with a tube to a port. The image shows Port D, but the sample port is configurable. -
In the DIC program, configure the General Settings.
-
Configure the Analytical Settings.
-
Click the Single tab to view the option for a single measurement: Volume and Port.
- A sample volume of 1.5 mL is recommended for seawater; a smaller volume may be used for porewater samples (see Support: LI-53x0A Dissolved Inorganic Carbon Analyzers).
- If measuring samples with very low DIC (e.g., sea-ice meltwater or lake water), use a larger sample volume (see Samples with very low DIC).
-
Click Start Analysis.
Results are displayed as the measurement is taken. Measurements will repeat until a consistent result is achieved.
-
Calculate the DIC content according to the linear regression function obtained during standardization (see Standardizing a measurement).
This can be performed with a spreadsheet. Alternatively, convert the final value directly into concentration units (µM or µmol/l), as illustrated in Figure 4‑1.
-
Record the sample temperature for each measurement.
This allows calculation of the sample density and conversion of units between µM and µmol/kg using equation 4‑4 (Millero and Poisson (1981)). Note that room temperature can be used if temperatures are not controlled with a water bath.
-
Clean up.
Follow the steps in After measurements - cleaning the valve to clean up after measurements.
From the correct equations1 in the full text of Millero and Poisson (1981), ρ is the density of water in kg m-3, ρ0 is the seawater density of water from Bigg (1967), S is salinity of the sample, and T is temperature in °C.
ρ0 = 999.842594 + 6.793952×10⁻²T − 9.095290×10⁻³T2 + 1.001685×10⁻⁴T3 −
1.120083×10⁻⁶T4 + 6.536336×10⁻⁹T5
A = 8.24493×10⁻¹ − 4.0899×10⁻³T + 7.6438×10⁻⁵T2 − 8.2467×10⁻⁷T3 +
5.3875×10⁻⁹T4
B = −5.72466×10⁻³ + 1.0227×10⁻⁴T − 1.6546×10⁻⁶T2
C = 4.8314×10⁻⁴
Batch sample analysis
Batch analysis is preferred over single analysis because the batch procedure automates the standardization, eliminating the manual calculations. Batch analysis can be used to measure a batch of samples - or a single sample.
-
Prepare sample materials, CRM, and the acid (see Preparing for measurements).
-
Connect the sample tube to a port, as shown in Figure 4‑3.

Figure 4‑3. For batch measurements, containers for standards, acid, samples, and waste collection are connected to the rotary valve with tubes. The waste collection container should be below the level of the waste discharge port. If measuring a single sample or a continuous underway measurement, only one sample tube is required. -
In the DIC program, configure the General Settings.
-
Configure the Analytical Settings.
-
Click the Batch tab to view options for batch measurements.
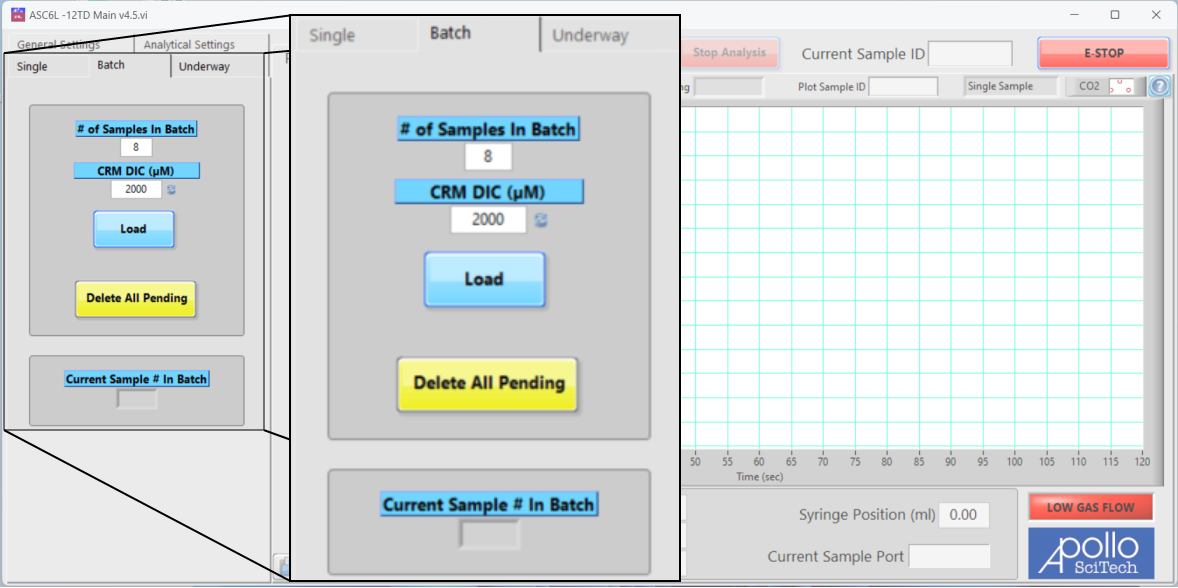
Figure 4‑4. Batch analysis and data tabs. If you choose to save data to a new file, the Data tab will be blank. If you append to an existing file, the tab should display all the data in that file.
-
Enter the # of Samples in Batch.
If measuring a single sample, set the batch quantity to 1.
-
Enter the CRM DIC (μM).
This is the DIC content of the Certified Reference Material.
-
Click the button to the right of the DIC number box and enter the certified DIC value in μmol/kg, salinity, and temperature of the standard.
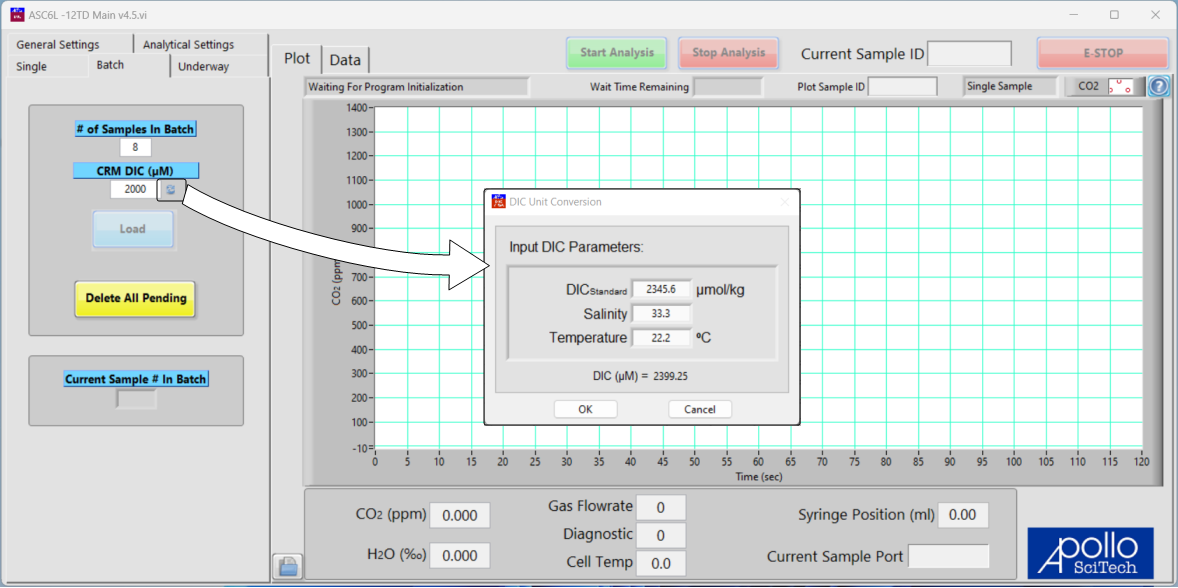
The software converts the certified DIC value in µmol/kg to µM using equation 4‑4 (Millero and Poisson (1981)).
-
Click Load and watch as one set of standards and the specified number of samples are added to the data tab.
The program will automatically switch to the data tab. Each volume of the standard and each regular sample takes up one line when being added to the data table. Additional rows of data are inserted in the table as more measurements are taken.
-
Enter the sample names in the designated boxes for each sample.
-
Put the tubes from ports C to K in the corresponding standard and sample containers.
-
Click Start Analysis.
The system will begin measuring samples and standards according to the configuration. As the data become available, measurements will be displayed on the screen and saved in the specified file.
At the end of each measurement, the plot is not immediately cleared. At this time, the current sample ID above the plot area is different from the plot sample ID within the plot area in the inset (Figure 4‑5). The inset can be turned on and off by clicking the question mark.

Figure 4‑5. Plot area with parameters of the measurement. This plot shows isotopes of CO2 provided by the LI-5370A with LI-7825. The LI-5300A and LI-5350A will display CO2 only. -
Clean up.
Follow the steps in After measurements - cleaning the valve to safely clean up after measurements.
Underway sample analysis
The underway process is best suited for on-board measurement for a continuous period. Underway measurements require the sample to be delivered with a water stream. Be sure to avoid analyzing old, stagnant water. For example, use a peristaltic pump to circulate sample through a 3-way connector with one end connected to the underway port and the other end discharging water to a drain. The water should be taken into the analyzer via a coarse rod or bag filter to avoid introducing large particles into the analyzer (see Figure 4‑6).
Results from underway analysis can have greater more uncertainty than batch measurement because the characteristics of the sample (temperature, salinity, etc.) can be highly variable and this is not easily accounted for in the analysis. For the greatest precision, you should refine a protocol that measures standards in conditions that are representative of the samples and use these measurements to compute the final results. Contact LI-COR if you have questions about the procedure.
-
Prepare sample materials, CRM, and the acid (see Preparing for measurements).
-
Connect the sample tube to a port, as shown in Figure 4‑6.

Figure 4‑6. For continuous underway measurements, the sample tube is connected to a water supply and Port D. The sample tube delivers sample to the DIC module with a user-supplied peristaltic pump, while a tube relieves pressure. -
In the DIC program, configure the General Settings.
-
Configure the Analytical Settings.
-
Click the Underway tab to view options for underway measurements.
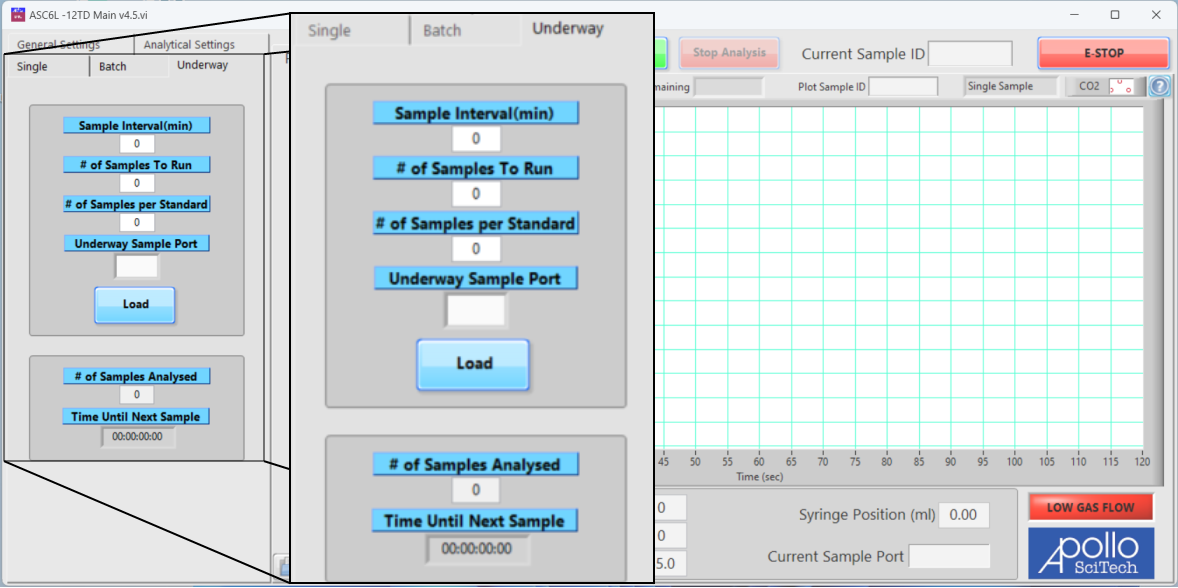
If you choose to save data to a new file, the Data tab will be blank. If you append to an existing file, the tab should display all the data in that file.
-
Enter the Sample Interval (min) (the wait time in minutes between each sample).
-
Enter the # of Samples to Run (the number of samples to take).
-
Enter the # of Samples per Standard (the number of samples after each set of standards).
-
Enter the Underway Sample Port (from D to K; whichever is taking the water sample).
-
Click Load to load the standards.
A set of standards is automatically loaded before the underway samples. The first underway sample, 1U, is loaded after the standard.
-
Click Start Analysis to start measuring samples.
After sample 1U starts, the countdown (Time Until Next Sample) will start. When it reaches zero, the next underway sample will be automatically added to the sample list and tested. After the last underway sample, the program will automatically run a set of standards.
-
Clean up.
Follow the steps in After measurements - cleaning the valve to safely clean up after measurements.
Stopping the analysis
Normally, the DIC module will proceed through all samples in the list and stop when it is done. You can stop the analysis at any time with either the red Stop Analysis button or the E-STOP (emergency stop) button.
- E-STOP puts an immediate stop to all actions. The program will not move the sample valve, the syringe, or the internal pinch valves. If you click E-STOP during discharge, the valves may be at positions to allow gas to go through the reactor at a high speed. Re-initializing the program will reset the internal valves.
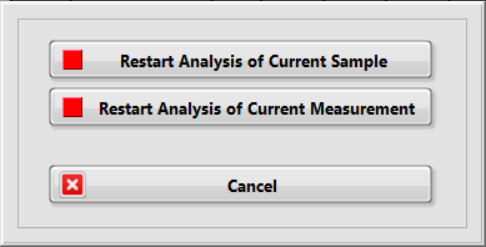
- Stop Analysis allows a more careful pause or stop to the analysis. If you click Stop Analysis and confirm in the subsequent prompt, the current sample will be halted, the system enter an idle state, and all pending samples remain pending. Click Cancel to return to the main window without affecting the current sample. After terminating the current sample with Stop Analysis, a Resume button will be displayed. Click Resume to continue or restart the halted sample (you have options; see Figure 4‑7).
- Restart Analysis of Current Sample: If there are any existing measurements with the status Analyzed, they become Not used (see Status). It restarts the current sample as if all the prior measurements of this sample did not exist.
- Restart Analysis of Current Measurement: It continues to the next repeat of the halted sample. If there are any prior measurements in the status Analyzed, they remain Analyzed and will be potentially used for calculating the average net area.
After measurements - cleaning the valve
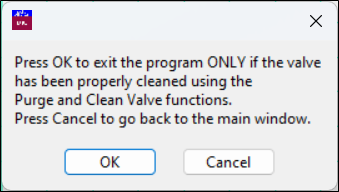
Caution: It is important to properly clean the analyzer before shutting it down. Inadequate cleaning may lead to damage.
After completing the analysis:
-
For each piece of tubing (the acid, standard, and all 8 samples), place the inlets into de-ionized (DI) water.
-
Click Purge (under the General Settings tab).
The DIC module will draw in a full syringe of DI water, inject it into the reactor to clean it, and then discharge the water.
-
Click Purge once again.
-
Click Clean Valve x2
The DIC module will draw 1/10th the syringe volume of DI water (0.25 mL with the LI-5350A or 0.5 mL with the LI-5300A) from each inlet tubing on port L and then port C through K and discharge the water from the waste line (via port B). It will complete this two times.
LI-5350A only: Repeat the step.
-
With all 10 inlets in air, click Purge and Clean Valve x1 once again.
LI-5350A only: Repeat the step to ensure the volume is flushed.
-
If you are going to resume measurements the following day, leave the gas analyzers powered on (the LI-7815 can be placed in sleep mode). You can power off the DIC module but leave the LI-850 powered on.
-
Power off the computer.
Special considerations
The procedures above are for typical samples. You can alter the procedure if you are working with small sample volumes, samples with very low DIC, or samples with high surfactant content.
Sample volume
- Large Samples: When a sufficient quantity (>1.5 mL) of sample is available, withdrawing the sample from a bottle or a vial with a tube is recommended.
- Small Samples: When the total sample volume is very limited, such as a total of 1 – 2 mL of porewater you can supply the sample directly from a syringe with a piece of short tubing. This method is preferred if CO2 degassing from a limited volume sample is a concern. Leave any valves or stopcocks between the syringe and the digital syringe pump open as the action of the digital syringe pump will draw the standard or sample solution directly from the glass or plastic syringe. Make sure the syringe’s internal plunger has a low resistance for moving.
- Very Small Samples: If you have a small sample volume (0.5 mL or less), use a 1/32” ID tubing to lower contamination by the previous sample.
Samples with very low DIC
The LI-5350A can be used to measure samples with very low DIC. Several modifications to the technique can assist with samples that have very low DIC (~100 μM).
Caution: Do not attempt these measurements with the LI-5300A or LI-5370A. Contact LI-COR before making the modifications for very low DIC samples.
-
A 1% H3PO4 (plus 7% NaCl) acid solution has proven to be adequate.
The analytical settings in Figure 4‑8 have been tested. The acid volume is lowered to accommodate larger sample volumes. Furthermore, less NaCl may be added to the acid solution for low salinity samples. This helps reduce the amount of aerosol in the system.
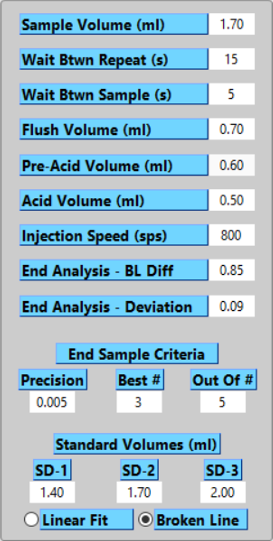
Figure 4‑8. Analytical Settings for low DIC samples -
The carrier gas flow rate can be lowered to 90 mL/min from 200 – 250 mL/min for typical seawater samples.
-
During the test, the CRM and surface seawater samples were diluted with DI water that has been bubbled with N2 for 20 minutes.
The diluted CRM or seawater was then transferred to Cali-5-Bond bags using a peristaltic pump. The acid solution was also bubbled with N2 for 20 minutes before being transferred to a gas tight bag. This is to avoid introducing CO2 to the low-DIC samples when adding acid to the sample.
Samples with high surfactant content
Some DIC samples may have high surfactant content (soil pore fluid, for example). Foam or bubbles may form during the analysis and go through the gas line. If foamy liquid enters the gas analyzer, it may be damaged. Great care must be exercised in analyzing high surfactant samples. If significant amounts of foam or bubbles are observed inside the gas stripper chamber, do not repeat the measurement of the same sample. Instead, remove the sample, place the sample intake line into DI water, and run the DI water as a sample until the bubbles disappear. You may open the case and flush the gas path with DI water and dry it with a compressed air. Also replace the hydrophobic filter.
For higher precision CO2 measurements
When taking measurements of uniform samples, such as over the open ocean where mixing is good and equilibrium between the air and water is achieved, you can attain higher precision measurements by purging all CO2 from the acid. When samples are less uniform, you are less likely to observe a benefit from this.
To remove CO2 from the acid, bubble compressed N2 or CO2-free air through the acid to purge CO2 (Figure 4‑9). Also, isolate the acid from CO2-rich air (Figure 4‑10) by purging the headspace air while scrubbing the incoming air of CO2 gas, thereby preventing diffusion CO2 into the acid.

