Data and records
Results are displayed in the interface as data are collected. You can load data from a file as well (historic data).
Viewing measurement data
-
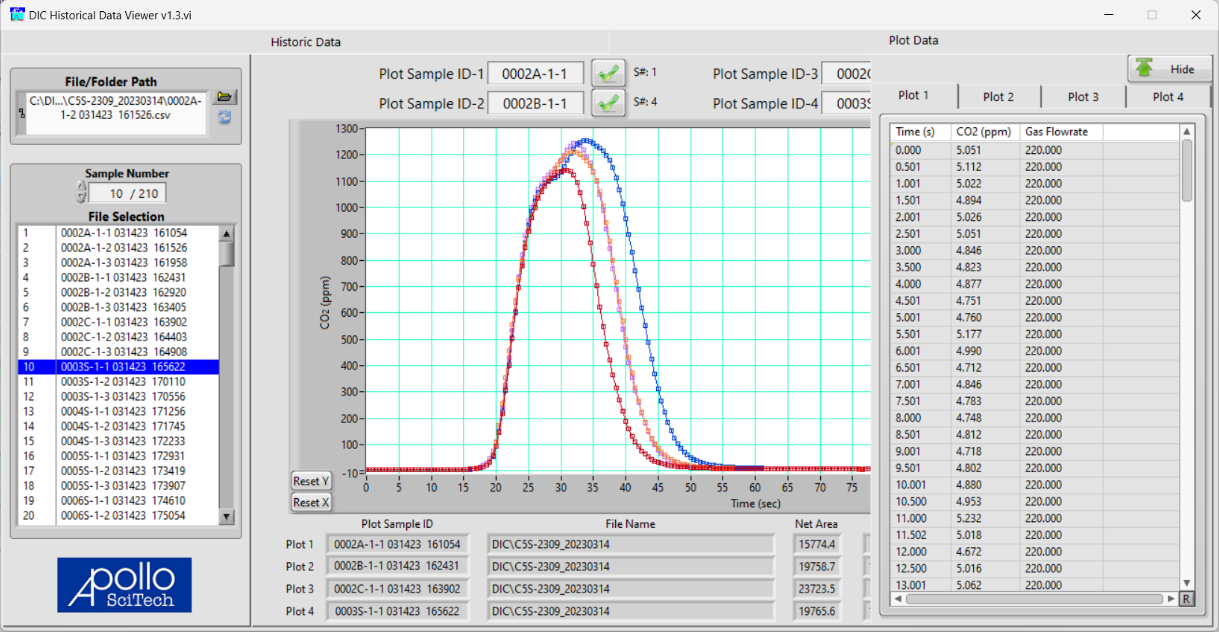
Click the folder icon near the bottom left corner of the plot area to view the Historic Data Viewer.
-
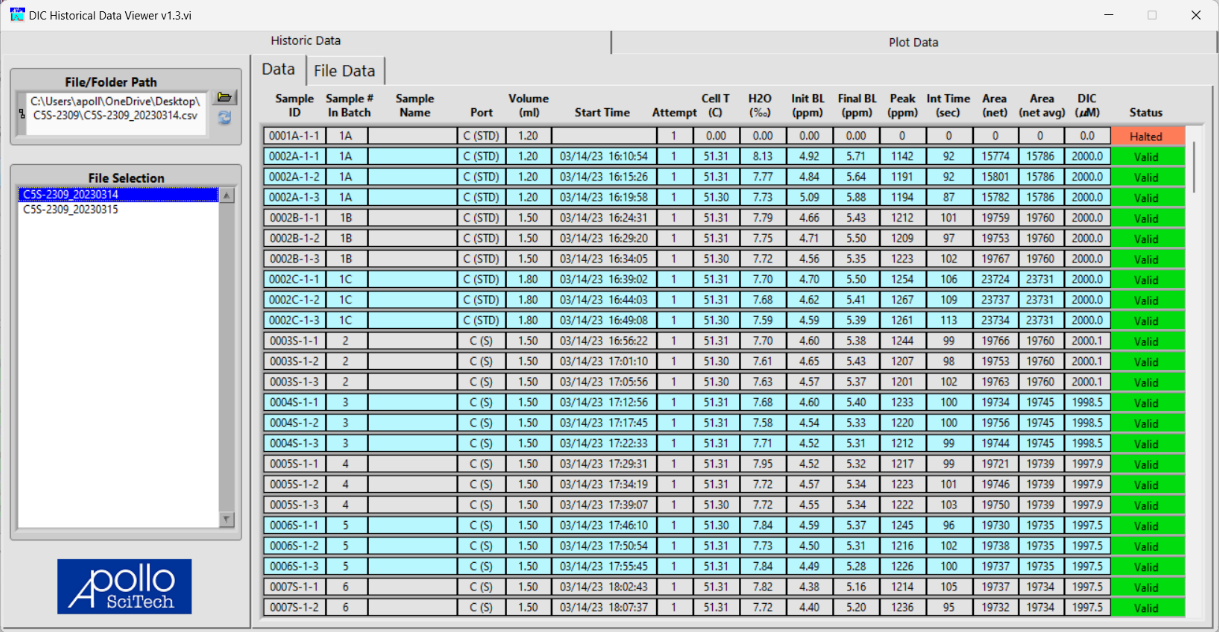
In the tab Historic Data, click the open folder icon to select a file.
All applicable files in the same folder will be displayed in the list under File Selection. The current file is highlighted in blue. All the data normally displayed in the data tab in the main program are displayed here in the data tab.
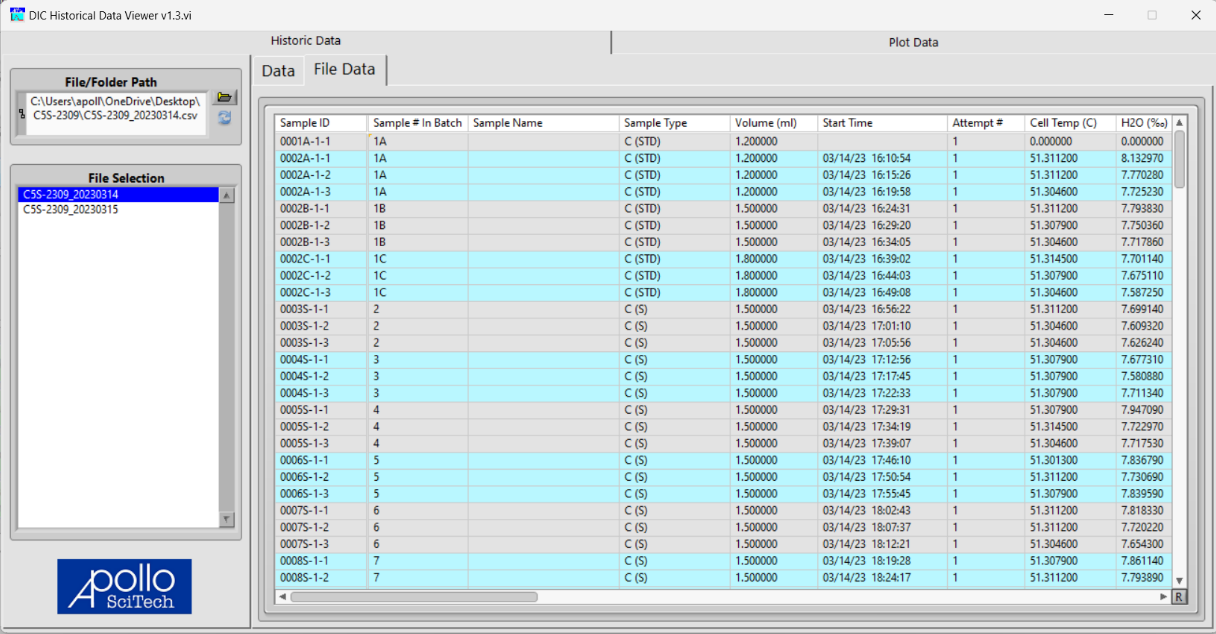
The File Data tab shows all columns saved in the .csv file. Scroll to the right to view other columns. Click the dividing line between two columns and drag to adjust the column widths and click the R button near the bottom right corner to reset the column widths. All of the repeats of the same sample are highlighted in the same color.
-
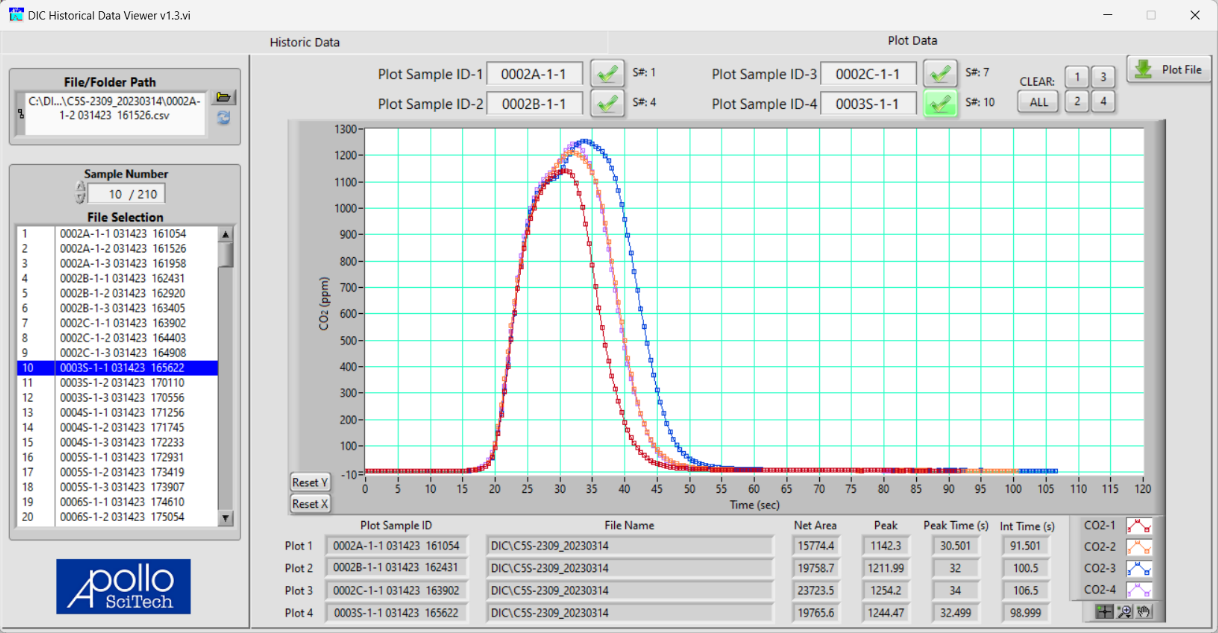
In the tab Plot Data, click the open folder icon to select a file.
-
In the tab Historic Data, click the open folder icon to select a file.
All applicable files in the same folder will be displayed in the list under File Selection. The current file is highlighted in blue.
-
Click the check mark by Plot Sample ID-2 to enable it and then select a different file to compare two plots.
Up to four plots can be enabled in a similar way. Only the plot with a highlighted check mark is updated when a file is selected. Clear any plot or all of them by clicking the corresponding number or ALL near the top right corner. Change the symbol and color of any plot near the bottom right corner.
-
At the top right corner, click Plot File to bring up the data points in the plots.
-
Click the dividing line between two columns and drag to adjust the column widths and click the button R near the bottom right corner to reset the column widths.
Data are given in the Data tab as columns, as described below.
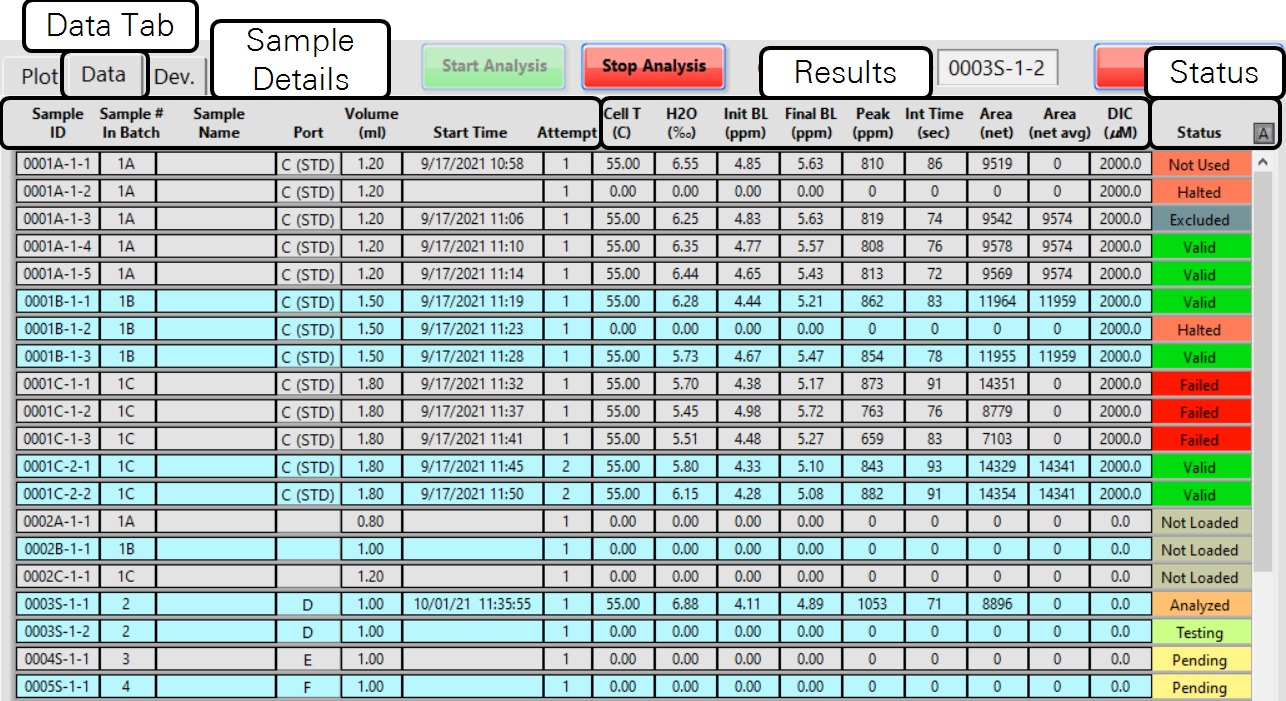
Sample details
- Sample ID is a unique sample identification in the current file. It is in the format nnnnA-n-n, where n represents a number and A represents a letter.
-
- The first 4 digits represent the number order of a sample in the data file, and range between 0001 and 9999. The standard has an A, B, or C attached to the number order to represent the smallest, medium, and largest volume. A sample has a S attached to the number order, no matter what type of analysis it is from, i.e., single, batch, or underway.
- The number between the two hyphens represents the number of attempts. The number is limited to be 1 or 2. After the 1st attempt fails, the program will automatically make a 2nd attempt for the same sample. When the 2nd attempt fails, if the failed one is a standard, the program will stop the analysis and alert the user to check the settings and the equipment. If the failed one is a sample, the program will move onto the next pending sample in the list. If two consecutive samples fail on both attempts, the program will also stop the analysis and alert the user. Whenever there is a failed attempt, it will play an alarm continuously until the user acknowledges the pop-up message about the failed attempt, regardless of whether the program continues to a 2nd attempt or the next sample, or stops the analysis.
- The number after the 2nd hyphen represents the number of measurements in the current attempt of the sample.
- Sample # in Batch is the sample number within the current batch. The number can theoretically be as high as the number of samples entered in the left panel plus 1, because a set of standards always precedes the samples. In practice, this is usually as high as 9, as there are 8 sample ports in the valve. Underway samples will have a U appended to the number in that underway sequence.
- Sample Name is for the user to enter sample names. The program will automatically fill in the sample name for the additional measurements required for the samples.
- Port assignment will cycle from D to K for the samples. The user needs to swap out sample containers at the appropriate time so as not to analyze the same sample more than desired. You may click the box in the Port column of a standard or a sample to unload, assign a port, or change the port assignment manually. However, it is recommended to run a set of standards every 8 samples or more often, so it is recommended to input 8 or a smaller number in the box in the left panel for the number of samples. A standard (A, B, or C in Sample ID) only draws from Port C.
- Volume (mL) is the volume of standard or sample specified in the Analysis Setting tab.
- Start Time is the time stamp when the program starts injecting sample into the reactor.
- Attempt indicates the number of attempts the program is currently on.
Results
Column headings are described below.
- Cell T (C) is the cell temperature of LI-7815. This temperature should not vary by more than 0.01 °C when the machine functions normally.
- H2O (‰) is the H2O reading from the LI-7815 when the measurement is finished.
- Init BL (ppm) is the CO2 baseline at the beginning of the measurement.
- Final BL (ppm) is the CO2 baseline at the end the measurement.
- Peak (ppm) is the peak CO2 concentration of the measurement.
- Int Time (sec) is the duration of the integration (of CO2 concentration with respect to time).
- Area (net) is the net integration area of the measurement.
- Area (net avg) is the average area of the 3 (or a different number specified by the user) measurements close to each other. Note that the calculated average will appear with all finished measurements, even when one or more are excluded from calculating the average.
- DIC (μM) displays either the user-input DIC for the standard or the calculated DIC of the sample based on the most recent standard.
Status
The Status column gives information about the state of measurements. The status is indicated by both words and colors (except for the Testing status).
-
 Pending: Sample is queued for measurement.
  Testing: Data are being collected for the current measurement.
-
 Not Loaded: Sample not current queued for measurement.
 -
 Analyzed: Measurement has been completed. The status will change depending on whether you restart the current sample (see Stopping the analysis) and how close the finished measurements are to each other.
 -
 Valid: Measurement was used for calculating the average net area.
 -
 Excluded: Measurement is valid on its own, but not used for calculating the average because it is very different from the rest of the measurements.
 -
 Halted: The operator elected to stop the analysis during this measurement, so no data are recorded for it. The program can auto abort a sample if the gas flow is abnormal.
 -
 Not Used: This measurement was completed, but the user later elects to restart the sample, so this measurement was only recorded but not considered the one of the five (or a different number specified by the user) measurements allowed in the current attempt.
 -
 Failed: The current attempt has reached the maximum allowed measurements but has not yield measurements close to each other to meet the precision requirement.