NEW
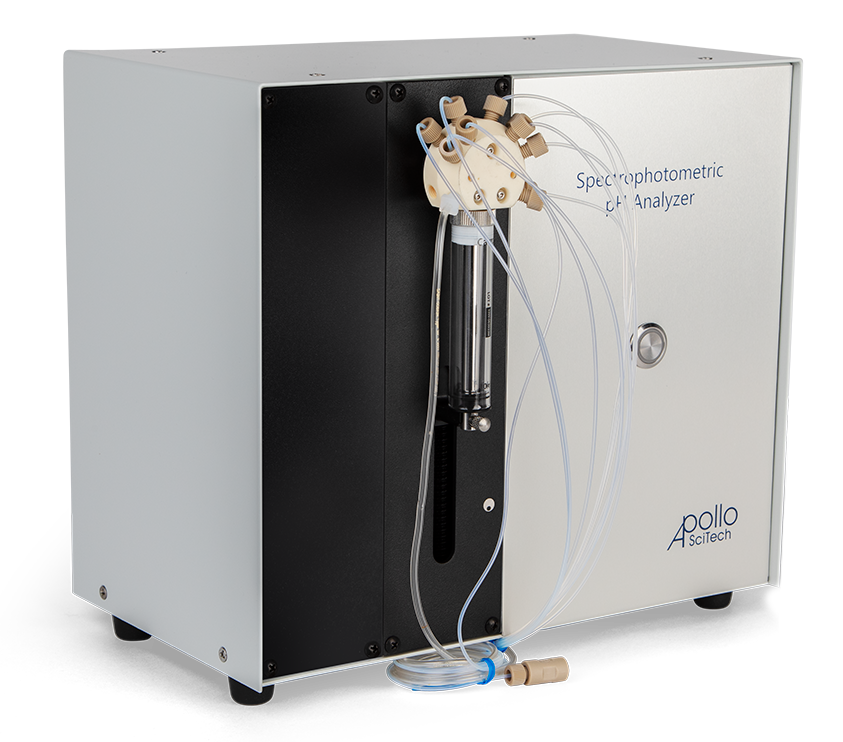
Spectrophotometric Seawater pH Analyzer
NEW Spectrophotometric Seawater pH Analyzer
Take precise pH measurements of seawater using optical absorption
Get a Quote
Why Measure Ocean pH?
pH regulation is critical for maintaining optimal living conditions within organisms and even across entire ecosystems. Changes in pH can disrupt essential cellular functions and compromise an organism’s health. Consequently, regular pH monitoring is an essential step in fields like environmental science, ecology, and oceanography in which researchers are interested in understanding and promoting healthy ecosystems.
Precise ocean pH measurements are pivotal in understanding the intricate dynamics of ocean ecosystems and, more recently, ocean acidification. Due to escalating carbon dioxide (CO2) emissions, the oceans have absorbed significant amounts in recent years, causing their pH levels to change. This phenomenon, called ocean acidification, is leading to a decline in coral reefs and shellfish populations. pH measurements, therefore, can help researchers better understand ocean carbon cycles, CO2 emissions, and ocean acidification.
What is pH?
pH is a measure of how acidic or basic a given substance is; it reports the thermodynamic state of all acid-base systems. A solution is acidic when there are more hydrogen ions or protons (H+) than hydroxide ions (OH-); conversely, a solution is basic when there are more hydroxide ions (OH-) than hydrogen ions.

Advantages of the Spectrophotometric Seawater pH Analyzer
- Higher precision and sensitivity than traditional measurement methods
- Deployable in a variety of locations
- Accurate, precise, and safe measurements
- Established research method published in scientific journals
How is it Measured?
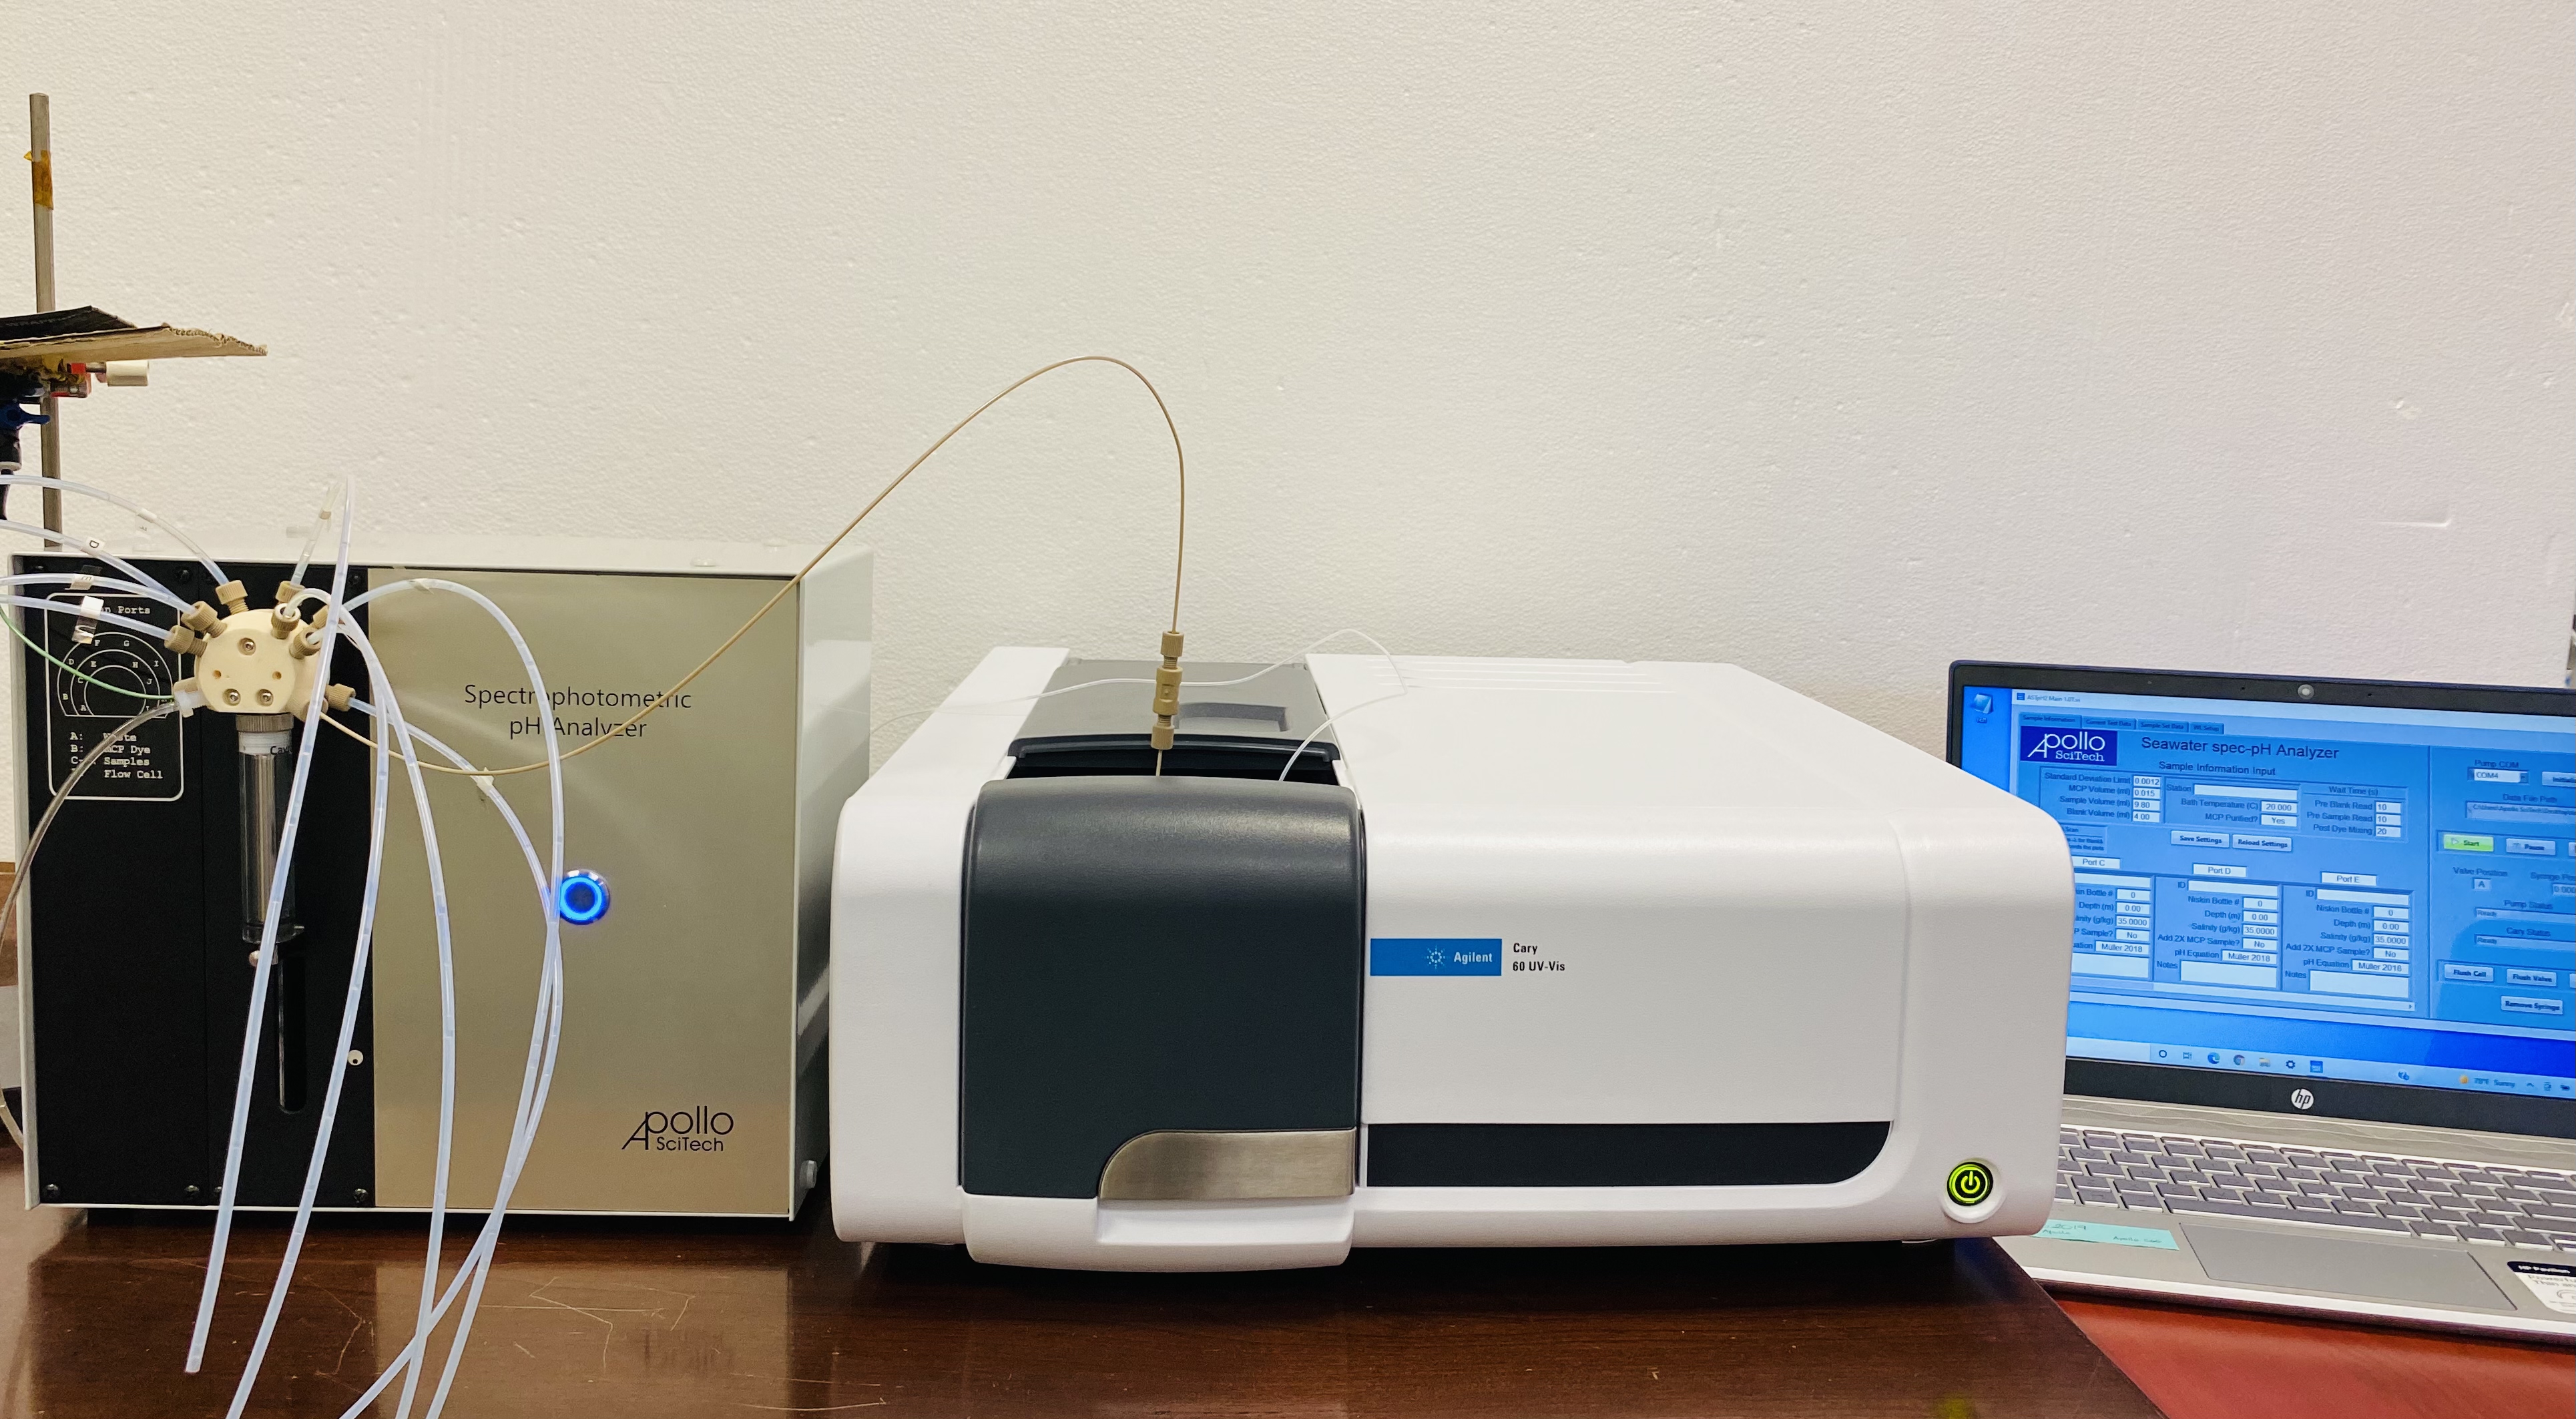
The Spectrophotometric Seawater pH Analyzer automatically measures pH from up to 9 samples in 45 minutes. To complete this process, the analyzer requires three components: the main unit that processes the water sample, an Agilent Cary 60 spectrophotometer used for colorimetric determination, and a water-jacketed flow cell installed in the spectrophotometer. A digital pump draws the m-cresol purple (mCP) pH indicator dye and the water sample into the analyzer. Using a process called colorimetric determination, m-cresol purple transfers into the seawater sample and measured by the analyzer. If the sample’s pH is between 2.8 and 7.4, the dye turns yellow; if the sample’s pH is 9.0 or above, it turns purple.
In addition to the pH analysis, a probe near the flow cell records the sample’s temperature.

Specifications
General
- Power requirements: 100 to 240 VAC; 50 / 60 Hz
- Precision: better than 0.001 pH units
- Accuracy: better than 0.003 pH units
- Temperature control system: 0.1 °C
- Samples: Up to 9 samples sequentially
- Sample volume: 40 mL
- Time per sample: ~ 5 minutes
- pH indicator: m-cresol purple
- Spectrophotometer: Agilent Cary 60
- Spectrophotometric flow cell: 10 cm optical path length with thermostated water jacket
- Operating temperature: 15 to 40 °C
- Computer: Windows® 10 OS
- Communication: RS-485 serial with USB adapter (included)
- Operating conditions: Indoor
- Dimension: 28 × 30 × 24 cm (H × W × D)
Specifications subject to change without notice.
References
Clayton, T.D. and Byrne, R.H. (1993). Spectrophotometric seawater pH measurements: total hydrogen ion concentration scale calibration of m-cresol purple and at-sea results. Deep Sea Research Part I: Oceanographic Research Papers, 40(10), pp.2115–2129. doi:https://doi.org/10.1016/0967-0637(93)90048-8.
Liu, X., Patsavas, M.C. and Byrne, R.H. (2011). Purification and Characterization of meta-Cresol Purple for Spectrophotometric Seawater pH Measurements. Environmental Science & Technology, 45(11), pp.4862–4868. doi:https://doi.org/10.1021/es200665d.
Carter, B.R., Radich, J.A., Doyle, H.L. and Dickson, A.G. (2013). An automated system for spectrophotometric seawater pH measurements. Limnology and Oceanography: Methods, 11(1), pp.16–27. doi:https://doi.org/10.4319/lom.2013.11.16.
Dive deeper into your research.
Get a Quote