In-Cell™ Western Analysis Overview
When an image with an In-Cell Western™ Analysis is the current image, the ICW Analysis tab is shown on the ribbon. To apply an In-Cell Western Analysis to any image, click the quick launch button at the top of the window and select In-Cell Western from the drop-down menu. Or, open the Analysis tab and select In-Cell Western from the drop-down menu in the Type group. The last used parameters are used to create the new analysis.

Plate Group
Plate Template
Click the Plate Template button to choose, save, or delete a template that determines the Plate and Well settings.
Templates are useful for quickly selecting the settings that are commonly used, however, you do not need to use a template to set up an ICW Analysis.
The Plate Template button resets to Custom when any of the Plate or Well method settings are changed. You can save the current settings to a new template.
- Click the Plate Template button and choose Save Current Template... from the drop-down menu.
- Enter a name for the new template and click OK.
- You can also delete a template from the list of available templates.
- Click the Plate Template button and choose Delete Template to open the Delete Grid or Plate Template dialog.
Select the template to delete and click Delete.
You cannot delete the template currently in use.
- Click Close.The template will be removed from the drop-down list.

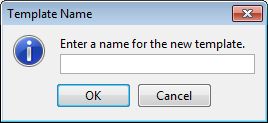
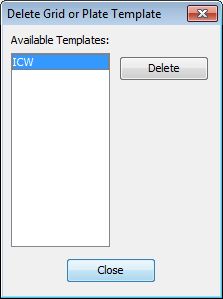
Plate Type
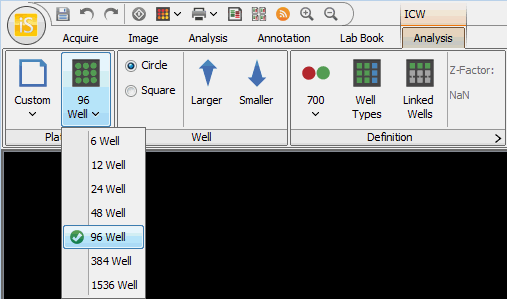
Choose the type of plate from the Define Plate Type drop-down list. You can choose from 6, 12, 24, 48, 96, 384, or 1536 well configurations.
Adjust the size of the plate by selecting the bounding box and dragging the green arrows on each side. Move the entire plate by dragging the double arrows that appear when hovering on the image.
Well Group
Use the Circle or Square buttons in the Well group to select the shape of the wells. Use the Larger or Smaller buttons to incrementally adjust the size of the wells for a better fit.
Definition Group
Define the ICW Analysis with the controls in this group.
The first button toggles between None, 700, and 800.
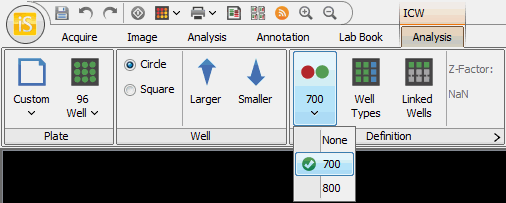
Use the first button to select the channel used to normalize the results. The normalization channel often detects the total amount of protein while the other channel detects the protein of interest (e.g., phosphorylated protein). In this example, the amount of phosphorylated protein in the other channel is adjusted by the total amount of protein detected in the normalization channel. This method accounts for variation in protein amount per well, resulting in better data.
Well Types
Click the Well Types button to open the Well Types dialog and assign each well as either Sample, 100% Std, Background, or None.

- Select the type of well to mark by clicking the name in the Well Legend.
- Click the well to assign the selected well type to that well.
Make multiple well assignments by dragging through the desired wells.
If more than one Background well is designated, all Background wells will be averaged for the ICW calculations. The same is true for 100% Std wells.
Background — The average pixel intensity of each background well will be calculated, and the background wells will be averaged to find the background value to be subtracted from wells designated Sample and 100% Standard.
Linked Wells — The pixel intensities from linked wells are averaged, and this average is used in the following calculations for each of the linked wells.
ICW Relative — After background subtraction, all wells designated as Sample or 100% Standard in a channel are divided by the intensity value of the well with the highest response. This well is given a value of 1.0, and the relative intensity values of the other wells will generally be between 0.0 and 1.0.
Negative relative intensities indicate the original intensity value was lower than the average background when the background was subtracted.
If a normalization channel is selected, the intensity value of each well in the other channel is divided by the relative intensity value of the corresponding well in the normalization channel.
ICW % Response — After background subtraction and normalization (if used), all wells designated as Sample are divided by the average of the wells designated as 100% Standard in that channel and multiplied by 100 to give a percentage response to the control in the 100% Standard.
All ICW % Response values for the normalization channel are reported as NaN.
ICW Std Dev — The ICW standard deviation is the standard deviation of the average of the pixel intensities from linked wells.
First, pixel intensities in all wells designated as Background in each channel are averaged, and the average is subtracted from the pixel intensities of all wells in that channel. Then, the relative intensity values are found by dividing all wells by the intensity value of the well with the highest response. The intensity values from the sample channel are divided by the relative intensity values from the corresponding wells in the normalization channel.
The Z-factor calculation uses these values in the following equation:

Linked Wells
Click the Linked Wells button to open the Well Links dialog. Select multiple rows or columns containing identical samples to average the response of these samples.
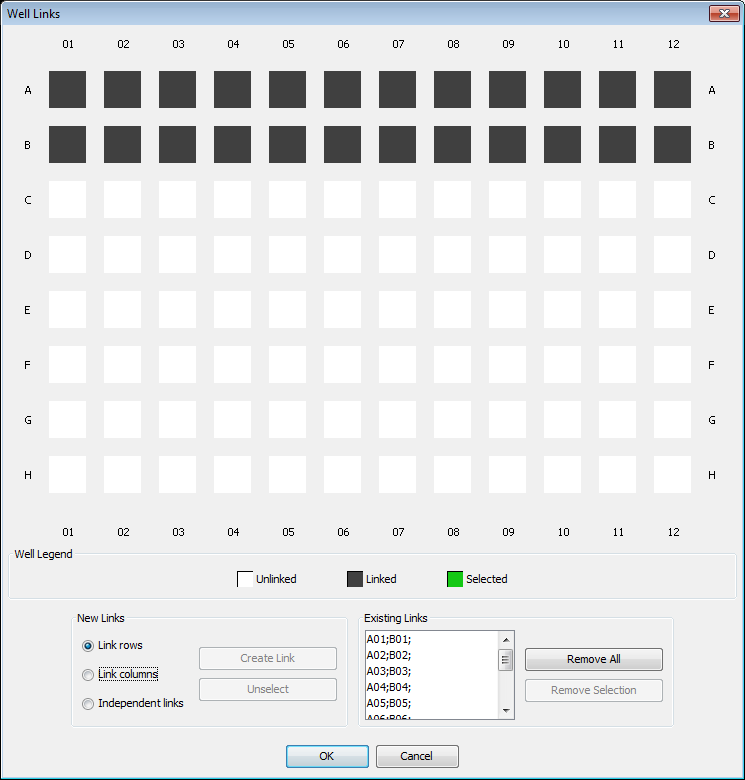
For example, if rows A and B are identically loaded, link the rows and the response from each pair of wells will be averaged.
- Drag through the rows to select them. They will be highlighted green.
- Select Link rows.
- Click Create Link. The linked rows will be black.
Each individual link (A01-B01, A02-B02, etc.) is listed in the Existing Links list. The analysis will average the linked wells in the Existing Links list and the averaged values will be used in ICW calculations rather than individual response values.
Individual wells can also be linked.
- Click individual wells to select them. Selected wells are highlighted green.
- Select Independent links, and click Create Link.
To dissolve a link, select the wells and click Unselect to change the well type from linked (green) to unlinked (white). Links can also be dissolved by clicking Remove All to remove all current row links, or selecting links in the link list and clicking Remove Selected. Shift+Click and CTRL+Click are available for multiple selections.
Advanced ICW Definition
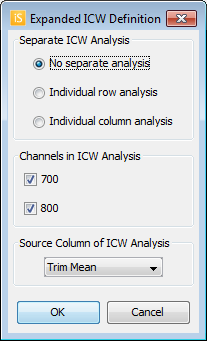
- For more options, click the arrow at the bottom right of the Definition group.
- This opens the Expanded ICW Definition dialog.
- Rows or columns can be analyzed individually. Only the background and 100% Standard well(s) in that row or column will be used in the analysis.
- Select the channels for the ICW analysis.
- Select the column to use in the ICW analysis for the response value, such as Total.

Show Group
Use the controls in the Show group to specify what to display on the image. You can display Wells, Labels, Quantification, andGrid Border (see Show Group for further details).
Z-Factor Analysis
Calculating the Z-factor for an assay produces a statistically derived, dimensionless value that can be used to characterize the quality of an assay during assay optimization and validation. The Z-factor indicates whether the assay has sufficient dynamic range and low enough data variability to generate meaningful data.
- Set up an analysis on the image using the controls in the Plate and Well groups on theICW Analysis tab (see In-Cell Western Analysis).
- Choose a normalization channel in which a housekeeping protein or protein stain is detected. The values from the other channel are divided by the values from the normalization channel to account for variations in cell number between wells.
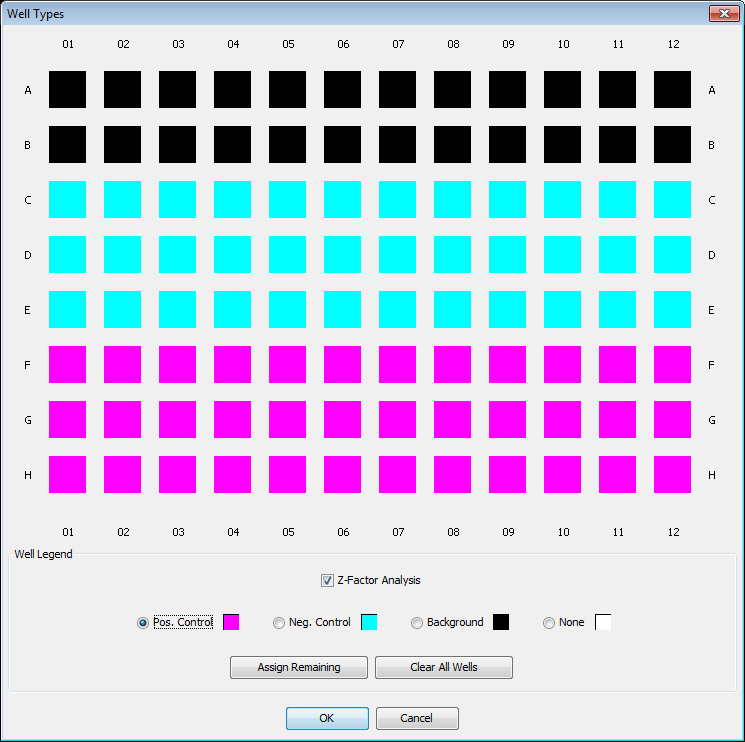
- Click the Well Types button to open the Well Types dialog.
- Click Z-Factor Analysis in the Well Legend. The dialog changes to accommodate a Z-Factor Analysis.
- Select the type of well to mark by clicking the name in the Well Legend.
- Click the well to assign the selected well type to that well.
- Make multiple well assignments by dragging through the desired wells.
- Click OK.


The Z-factor calculation appears in the Definition group. For a description of the calculation, see Calculation Descriptions.
The options in the Expanded ICW Definition dialog are not available for Z-factor analysis.