Normalization Handbook
What You Will Learn from This Guide
Normalization is a critical part of attaining reproducible data from quantitative Western blots. Recent changes, notably updates to the Journal of Biological Chemistry's submission guidelines (1), necessitate a closer look at traditionally accepted normalization practices.
This guide summarizes the basic principles of normalization and explains how to use these principles to accurately normalize Western blot data using one of three different normalization strategies.
Throughout this guide, the Journal of Biological Chemistry's submission guidelines and other peer reviewed normalization method papers will be referenced to provide context and sources of additional information.
This guide is a general overview of normalization principles, not a specific protocol. The reader must apply the general information from this guide to specific protocols as appropriate.
To learn more about the key principles of normalization, see "Normalization Basics".
To quickly get started with choosing a normalization method, see "Quick Stop for Choosing a Normalization Strategy".
The Ideal World vs The Real World
Under ideal circumstances, normalization would not be necessary for Western blots. Each sample would contain a uniform, consistent amount of sample protein, and the total protein signal measured for each sample would be the same. The signal for your target protein might be the same in each sample, or it might differ based on your experimental treatment.
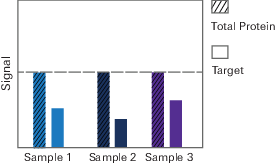
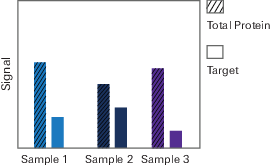
However, in the real world, it is not possible to load exactly the same amount of protein from each sample. Even if it were possible to get the same amount of protein from each sample into a gel, transfer efficiency from the gel to the blot will be different from lane to lane. Further, detection method limitations may affect the accuracy of detection.
Quick Stop for Choosing a Normalization Strategy
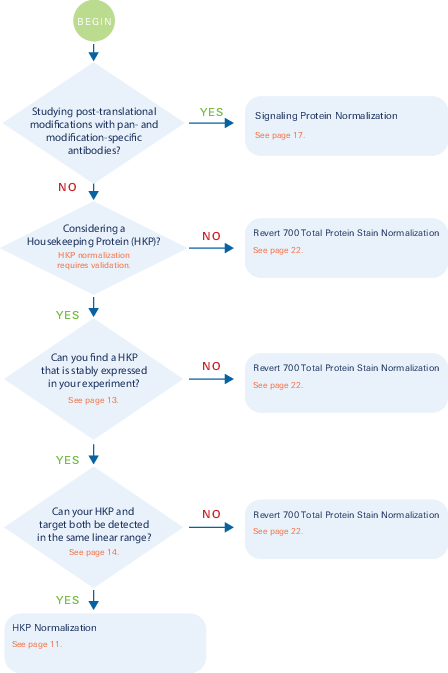
The flow chart on the following page will walk you through the steps necessary to choose an appropriate normalization strategy for your experiment. The necessary validation will vary based on the method you choose. More details on each method and additional information about normalization is provided later in the handbook.
Decision Tree
Side by Side Comparison
Normalization Technique | Verify Biological Stability (See Requirement 1) | Verify Linearity (See Requirement 2) | Min. Test Blots Required |
| Housekeeping Protein (HKP) | ✔ | ✔ | 2 or more 1 to determine stability of HKP expression 1 to determine linearity |
| Revert™ 700 Total Protein Stain | NO | ✔ | 1 to verify linearity |
| Signaling Protein Strategy | NO | ✔ | 1 to verify linearity |
Normalization Basics
Accuracy in quantitative immunoblotting relies on appropriate normalization and minimizing error. To minimize error, you must use a protein concentration assay (such as BCA) to adjust sample concentrations and make sample loading as consistent as possible.
Normalization is necessary because small lane-to-lane and sample-to-sample variations are unavoidable in Western blotting, even if you do carefully minimize error.
Normalization
Use of an internal loading control to mathematically correct for small, unavoidable sample-to-sample and lane-to-lane variations in loading and transfer.
Internal loading control (ILC): Endogenous reference protein(s) that are present in all samples at a stable level and unaffected by your experimental conditions.
Linear range (LR): The range of sample loading that produces a linear, proportional relationship between band intensity and the amount of sample loaded.
Key Principles and Requirements for Accurate Normalization
All normalization methods described in this guide can accurately correct for small, unavoidable variation if the following core normalization principle is valid:
Core normalization principle
Target and internal loading control signals must vary to the same degree with sample loading (11).
To ensure this core principle is valid and your normalization method is accurate, verify that your internal loading control meets the following requirements.
Internal Loading Control Expression Must be Unaffected by Experimental Conditions
ILC expression must be stable in your experiment for accurate normalization. If the target and ILC vary to different degrees with sample loading, the Core Normalization principle will not hold and normalization accuracy could be affected.
ILC and Target Must be Detected Within Same Linear Range
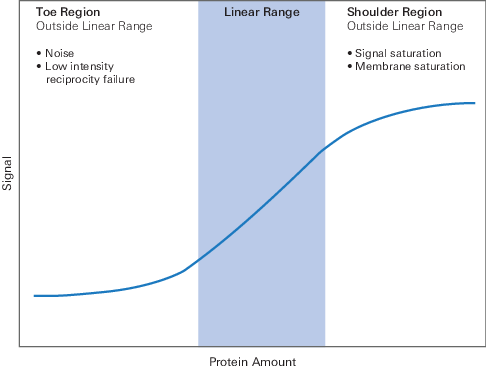
Linear range
The span of signal intensities that display a linear relationship between amount of protein on the membrane and signal intensity recorded by the detector.
Outside the linear range of sample protein loading, the relationship between the amount of protein and the measured signal is unknown. The measured signal for ILC and target will not vary to the same degree with sample loading, so the Core Normalization principle will not hold. Normalization accuracy could be affected.
The following are some factors that can cause signals to fall outside the linear range of the system.
Signal saturation
When signal intensity from a band is too bright for the detector to accurately record, signal saturation occurs. Saturated bands cannot be quantified, because the relationship between the amount of light recorded and the amount of protein in the corresponding band no longer holds.
Although saturation can occur on some digital systems, film is particularly prone to signal saturation. Film records signal through the use of silver grains that are activated in response to light. Saturation occurs on film when the finite number of silver grains in a region of the film have all been activated, meaning no more light can be detected.
In addition, film becomes progressively less responsive to light as it nears saturation. As more silver grains are activated by photons, it becomes statistically less likely that each new photon will strike a grain that has not already been activated (18, 19). Photons that do not activate silver grains will not be recorded as signal.
Low-intensity reciprocity failure
Specific to film, this problem occurs when light is too dim to be recorded. At very low intensities of light, film is less responsive and is disproportionately insensitive. Although this property keeps background low, it also causes faint signals to be underrepresented (18).
The light-sensitive silver grains in film must be impacted by multiple photons within a given time period, or the grains will revert to the unactivated state and will not be recorded as signal. This means that faint bands may not emit enough signal to be recorded on film, compromising the accuracy of the quantification and normalization.
You must determine the range of sample loading that produces signals within the linear range of your system. For accurate normalization, work only within that range for sample loading.
ILC Must Not Interfere with Target Detection
The internal loading control must not interfere with detection of the target.
| Normalization Technique | Possible Downstream Detection Interference |
| Housekeeping Protein (HKP) Normalization | If you are using chemiluminescence detection or a one-color fluorescent system, the HKP must not comigrate with target. |
Stain-Free™ and CyDye™ (Covalent Labeling Methods) | Irreversible covalent modifications may interfere with target detection. For more information about Stain-Free™ covalent labeling, see this technical note http://www.bio-rad.com/webroot/web/pdf/lsr/literature/Bulletin_5781A.pdf |
| Revert™ 700 Total Protein Stain | Detection with the 800 nm channel is recommended for low abundance targets to avoid possible background in the 700 nm channel. |
| Signaling Protein Strategy | Check for epitope interference Verify Epitope Interference Is Not Affecting Normalization. |
Normalization Corrects for Some Sources of Variability
The normalization methods described in this document can accurately account for the following sources of variance, assuming they meet the core requirements for accurate normalization.
Unequal protein sample concentration: For normalization to be effective, a protein concentration assay must be used to adjust sample concentrations and make sample loading as consistent as possible.
Inconsistent sample loading across the gel: Sample viscosity and pipetting inconsistency can introduce variation from lane to lane.
Transfer variation: Temperature, membrane binding capacity, membrane position in the transfer tank, and edge effects can all contribute to transfer variability, even when appropriate levels of protein are loaded. You may need to optimize transfer buffer conditions, voltage, transfer time, or other factors.
The Odyssey Loading Indicator provides a method for determining consistency of loading and transfer.
Normalization Cannot Correct for All Sources of Variation
Normalization cannot correct for the following factors.
Signal saturation: Signal saturation occurs when signal surpasses the intensity limit that your detection system can record. Film saturates very easily. On film, strong bands become saturated very quickly, and many digital imagers are also limited by signal saturation.
Membrane saturation: The blotting membrane does not have an unlimited capacity to retain protein. When sample proteins exceed the maximum binding capacity in an area of the membrane, membrane saturation occurs. Although there may be more sample protein present, the excess protein cannot be retained in that area and is washed away. Membrane saturation may result in under-estimation of strong bands and may compromise the accuracy of the data.
A normalization factor cannot be reused between blots. Normalization must be performed separately for each blot.
Housekeeping Protein Strategy
The housekeeping protein (HKP) strategy is used to normalize the target to a single unrelated endogenous protein that is present in all samples and is unaffected by experimental conditions or treatments. Common housekeeping proteins include GAPDH, actin, and tubulin, but the type of HKP used should be chosen to represent the target (if the target is mitochondrial, choose a mitochondrial HKP).
The HKP normalization strategy requires more extensive validation prior to use than the other methods mentioned in this guide. Since only one protein is employed for reference, the accuracy of the normalization procedure will be compromised by variations in the single HKP's expression.
HKP Expression Can Be Unstable to Treatment Conditions
HKP normalization reformulates the hypothesis of your experiment. Instead of determining differences between target protein levels, the hypothesis has been reformulated to ask how much target protein there is relative to a given HKP (11).
"'House-keeping' proteins should not be used for normalization without evidence that experimental manipulations do not affect their expression." - Journal of Biological Chemistry's submission guidelines (1).
Many factors can affect HKP expression, reducing normalization accuracy (4 - 15).
Cell confluence
Experimental manipulation (such as temperature, cell confluence, or drug treatments)
Tissue type
Cell line
Age of culture
Disease or injury state
HKP May Not Be Detectable Within Linear Range of Target
Many frequently studied target proteins are low-abundance compared with ubiquitous HKP and structural proteins (11).
If your target is low-abundance, but your HKP is highly abundant, the two different proteins will produce bands with very different intensities. This makes it likely that you will need to load a large amount of sample to detect your target, which will cause your HKP bands to become saturated. Once HKP saturation occurs, accurate normalization can no longer be conducted.
Saturated bands cannot be quantified, because the relationship between the amount of light recorded and the amount of protein in the corresponding band no longer holds. The HKP is no longer an accurate indicator of sample loading.
If you need to load a large amount of sample to detect a low-abundance target, using a low-abundance HKP like COX IV may help prevent HKP saturation (2). Remember, choose a HKP that accurately represents your protein type (mitochondrial HKPs should be used for mitochondrial targets).
No matter which HKP you choose, you must always validate your choice of HKP carefully before use.
Detection Interference May Occur if HKP Is Similar MW to Target
If you are using chemiluminescence detection or a one-color fluorescent system for housekeeping protein normalization, you must ensure that your target and HKP can be detected without interference.
HKP Validation Procedure
You must run at least two separate test blots to ensure your HKP meets the requirements for normalization.
Test blot 1: Run a test blot with a panel of candidate HKPs to find a HKP that is unaffected by the conditions of your experiment. Verify That HKP Is Not Affected by Treatment
Test blot 2: Run another blot to verify that the HKP candidate you selected based on the first blot can be detected in the same linear range as your target. Verify That HKP Is Detectable Within Same Linear Range as Target
Always remember to document your validation procedure and results.
Step 1. Avoid Detection Interference: Choose HKPs with Appropriate MW
If you plan to use chemiluminescence detection, begin by ensuring the HKPs you are considering for normalization are not close in MW to your target. The target and HKP must not comigrate.
If you are using two-color near-infrared fluorescence detection on an Odyssey Imaging System, there is no need to worry about this step.
Step 2. Verify That HKP Is Not Affected by Treatment
Run a Western blot with equal concentrations of treated and untreated samples with the same range of doses you plan to use.
Since a suitable HKP has not yet been identified for normalization, use one or more of the following methods to ensure the most consistent possible loading.
- Protein Concentration Assay: Use BCA, or a similar concentration assay, to quantify sample concentration and adjust for even loading.
- Duplicate Gel: Stain a duplicate gel with Coomassie stain, and use NIR fluorescence to quantify protein and check for even loading.
Total Protein Stain: Stain the membrane with a total protein stain to quantify protein and check for even loading.
The Odyssey Loading Indicator provides a method for determining consistency of loading and transfer.
Probe for each candidate HKP.
Select a HKP that is expressed consistently across treated and untreated samples for further evaluation (continue with Verify That HKP Is Detectable Within Same Linear Range as Target).
Step 3. Verify That HKP Is Detectable Within Same Linear Range as Target
Perform a Western blot with a serial dilution of sample (an 8-12 point, two-fold serial dilution is a good place to start).
Use a two-color Western blot protocol (see licor.com/WesternWorkflow).
The dilution series should include samples with concentrations above and below the concentration you expect to use.
Quantify signal from the target and HKP loading control.
Export quantification data to a spreadsheet program.
Plot protein concentration vs signal for both the target and HKP.
Find a linear trendline for the target and HKP loading control that meets your requirements for correlation strength.
You will probably need to iteratively exclude high and low points from each trendline until you find a range of data points that produces an appropriate linear range.
Determine the median concentration from the combined target and HKP linear range.
Based on the median concentration, select a sample concentration for your experiment that will allow your target and HKP to be detected within the same linear range (Figure 93).
- Under many circumstances, the median concentration will be a good place to start.
- If you hypothesize that your target will be strongly upregulated or down-regulated, you may need to start with a concentration above or below the median to ensure your target and HKP are within the same linear range for all your samples.
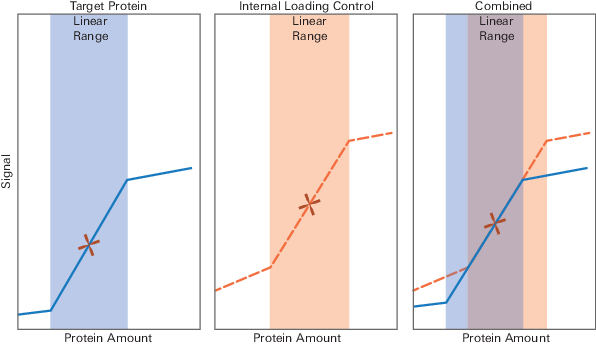
Figure 93. Choose a homogenate concentration that falls in the middle of the combined linear range for target detection and HKP detection.
If the median concentration is outside the linear range for the target or HKP, find another HKP or use another normalization method (such as Revert™ 700 Total Protein Stain).
Step 4. Document Validation Procedure and Results
Document your normalization procedure and results to ensure that all experimental details will be available for publication of your results. If your experimental protocol changes (e.g. you get a new antibody lot or use a different transfer method), carefully consider if you need to revalidate your chosen HKP loading control. Be sure to document the new procedure if anything changes.
Housekeeping Protein Data Analysis
Once you have validated a HKP for your experiment and documented your validation procedure, you are ready to perform your experiment and normalize your data.
Normalization factors must be calculated for each blot. Normalization factors and standard curves cannot be reused between blots.
Quantify target and HKP loading control in each lane.
Calculate the lane normalization factor.

Lane Name HKP Signal Highest Signal Lane Normalization Factor A 900 1000 0.9 B 700 1000 0.7 C 1000 1000 1.0 D 800 1000 0.8 Example numbers shown for illustrative purposes only.
Calculate the Normalized Signal to be used for relative quantitative comparisons.

Lane Name Target Signal Lane Normalization Factor Normalized Signal A 90 0.9 100 B 70 0.7 100 C 100 1.0 100 D 80 0.8 100 Example numbers shown for illustrative purposes only.
Only use the normalized signal for relative quantitative comparisons.
Although a simple ratio of the target to HKP will give you the same value proportionally, the ratio does not demonstrate the relationship of the normalized quantification to the raw measurement.
Signaling Protein Strategy
The signaling protein normalization strategy (SPS) is used to monitor changes in post-translational modification of proteins. SPS normalizes a specific modification of a target protein against all target protein regardless of modification. The target protein is used as its own internal loading control.
SPS normalization can be used for normalization in the study of any post-translational modification, where suitable antibodies are available (20, 21, 22).
“Signals obtained using antibodies specific for phosphorylated epitopes should be normalized to the total protein level of the target protein.” Journal of Biological Chemistry's submission guidelines (1)
SPS normalization employs two primary antibodies raised in different hosts.
Modification-specific antibody: An antibody against a specific modification of the target protein.
Pan-specific antibody: An antibody that recognizes all target protein regardless of modification.
Spectrally-distinct fluorescent secondary antibodies are used to detect the modification-specific and pan-specific antibodies at the same time on the same blot (multiplex fluorescent detection).
Phosphorylation stoichiometry cannot be determined solely through the use of this method (3).
Avoid using chemiluminescence detection for SPS normalization. See "Avoid Chemiluminescent Detection for SPS Normalization".
SPS Normalization Valid Despite Biological Variability
When normalizing with SPS, you do not need to perform any validation for Requirement 1. Because the target protein itself is used as the internal loading control, changes in target protein expression are intrinsically accounted for.
ILC Signal May Fall Outside Linear Range of Target
SPS normalization will not be accurate if the sample loading is outside of the linear range of the pan-specific protein signal.
Epitope Interference May Affect Downstream Detection
Epitope interference may occur if antibodies against different epitopes on the same target interfere with each other's ability to bind the target. The two different antibodies used in SPS normalization, modification-specific and pan-specific, recognize different epitopes on the modified form of the protein. If the two antibodies interfere with each other's ability to bind, normalization will not be accurate.
For the most accurate normalization, ensure that epitope interference does not interfere with your SPS normalization. See Verify Epitope Interference Is Not Affecting Normalization below.
Signaling Protein Validation Procedure
Step 5. Verify Epitope Interference Is Not Affecting Normalization
Check antibody data sheets to ensure the two primary antibodies recognize different regions of the protein.
The Antibody Publication Database can help you find antibody pairs that work for your experiment (licor.com/antibodyrequest).
Polyclonal pan-specific antibodies are less likely to experience epitope interference. Even if one epitope is blocked, the polyclonal antibody may be able to bind other epitopes.
You may wish to empirically verify that epitope interference is not occurring.
For example, in 2015, Bakkenist et. al. (17) demonstrated one method that can be used to evaluate binding interference between primary antibody pairs. Identical blots were incubated with modification and pan-specific antibodies separately (singleplex), or with both antibodies simultaneously (multiplex). Relatively little variation in signal intensity was measured between pan-specific antibody from multiplex and singleplex blots.
Step 6. Verify Linear Range
Perform a Western blot with a serial dilution of sample.
The dilution series should include samples with concentrations above and below the concentration you expect to use.
Quantify signal from the pan-specific antibody and modification-specific antibody.
Export quantification data to a spreadsheet program.
Plot the protein concentration vs signal for both modification- and pan-specific signals.
Find a linear trendline for the pan- and modification-specific proteins that meets your requirements for correlation strength.
You will probably need to iteratively exclude high and low points from each trendline until you find a range of data points that produces an appropriate linear range.
Determine the median concentration from the combined pan- and modification-specific linear range.
Based on the median concentration, select a sample concentration for your experiment that will allow your target to be detected within the linear range for every sample.
- Under many circumstances, the median concentration will be a good place to start.
- If you hypothesize that your target will be strongly upregulated or down regulated, you may need to start with a concentration above or below the median to ensure you are working within the correct linear range for all your samples.
Step 7. Document validation procedure and results
Document your normalization procedure and results to ensure that all experimental details will be available for publication of your results.
Western Blot Protocol with Signaling Protein Normalization
Once you have validated your signaling protein normalization strategy, follow the standard protocol for a two-color Western blot to detect the modification-specific and pan-specific target protein on the same blot.
Avoid Chemiluminescent Detection for SPS Normalization
Methods such as two-color fluorescence or detection of replicate blots are the recommended alternatives to stripping and reprobing.
Chemiluminescent detection makes accurate normalization with SPS difficult.
Blots are sometimes stripped and reprobed with a pan-specific antibody, but it’s essential to confirm that the original modification-specific antibody is completely removed. Any residual antibody will create artifacts when the blot is reprobed. Complete removal of antibodies can be difficult, and may require harsh stripping conditions that cause substantial loss of transferred proteins from the membrane (3, 4, 16).
Data Analysis for SPS Normalization
Once you have validated the SPS strategy for your experiment and documented your validation procedure, you are ready to perform your experiment and normalize your data.
Normalization factors must be calculated for each blot. Normalization factors and standard curves cannot be reused between blots.
Quantify the target modification and pan-protein loading control in each lane.
Calculate the Lane Normalization Factor.

Lane Name Pan Protein Signal Highest Signal Lane Normalization Factor A 900 1000 0.9 B 700 1000 0.7 C 1000 1000 1.0 D 800 1000 0.8 Example numbers shown for illustrative purposes only.
Calculate the Normalized Signal for use in relative quantitative comparisons.

Lane Name Modified Protein Signal Lane Normalization Factor Normalized Signal A 90 0.9 100 B 70 0.7 100 C 100 1.0 100 D 80 0.8 100 Example numbers shown for illustrative purposes only.
Only use the Normalized Signal for relative quantitative comparisons.
Although a simple ratio of the modified target protein to pan-protein will give you a proportionally similar value, the ratio does not demonstrate the relationship of the normalized quantification to the raw measurement.
Revert™ 700 Total Protein Stain Strategy
The Revert 700 Total Protein Stain strategy is used to normalize target protein to the total amount of sample protein per lane.
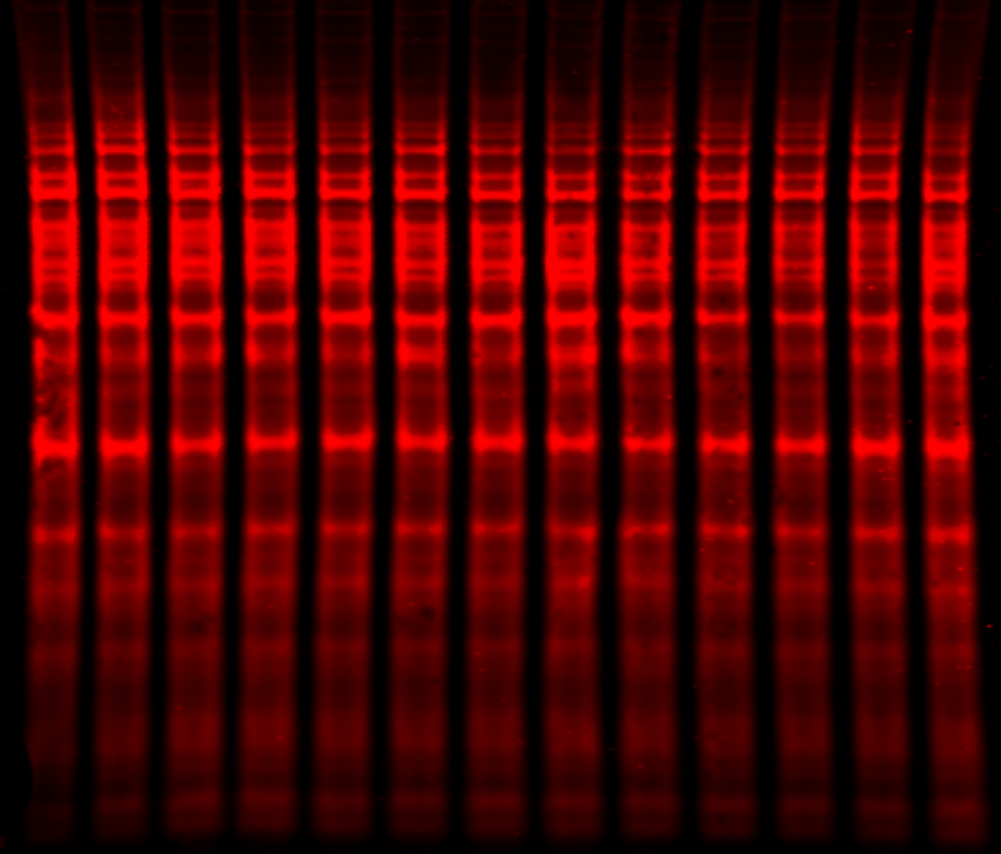
Revert 700 Total Protein Stain is a membrane stain that fluoresces at 700 nm and does not covalently modify sample proteins and therefore does not affect antibody binding or quantification. Revert 700 Total Protein Stain provides high signal intensity with a broad, linear quantitative range. Stained proteins produce signal that can be detected visibly and by imagers capable of detecting dyes that have excitation and emission maxima near 700 nm. With an imaging system capable of multiplex detection, you can image the total protein stained with Revert 700 Total Protein Stain in the 700 nm channel and image a target protein in the 800 nm channel on the same blot. You can also remove the total protein stain and process the blot to detect two different targets in the 700 and 800 nm channels.
With a total protein stain, you will be able to monitor protein transfer across the entire blot at all molecular weights. This will allow you to determine if there are any irregularities that indicate you should run the blot again to get more robust results.
Total Protein Stain Normalization Unaffected by Biological Variation
When normalizing with Revert 700 Total Protein Stain, you do not need to perform any validation for Requirement 1.
Total protein staining measures the aggregate protein signal in each lane, and eliminates the error that can be introduced by using a single internal control protein (11, 6, 23, 10, 24). Rather than using a single internal control protein as a surrogate marker for sample concentration, total protein staining directly compares the aggregate sample protein in each lane.
Revert™ 700 Total Protein Stain Can Be Detected Over a Wide Linear Range
A linear range of 1 - 60 µg of lysate has been measured for Revert 700 Total Protein Stain on Odyssey Imaging Systems.
Detect Faint Target Signals in 800 nm Channel to Avoid Possible Background Interference
Detection with the 800 nm channel on an Odyssey Imager is recommended for low abundance targets. Background in the 700 nm channel may interfere with faint 700nm target signals.
Revert™ 700 Total Protein Stain: Linear Range Validation
Unlike for HKP normalization, you do not need to validate Revert 700 Total Protein Stain for each experimental context and biological system.
As with every normalization strategy, you must still ensure your target and your ILC can be detected within the same linear range. In this case, your ILC is the total protein in each lane on the blotting membrane stained with Revert 700 Total Protein Stain.
Step 8. Revert™ 700 Total Protein Stain Linearity Validation
Perform a Western blot with a serial dilution of sample.
See the Revert 700 Total Protein Stain one-color protocol licor.com/revert.
The dilution series should include samples with concentrations above and below the concentration you expect to use.
Quantify signal from the target and the total sample protein (stained with Revert 700 Total Protein Stain).
Export quantification data to a spreadsheet program.
Plot the protein amount vs signal for both the target and Revert 700 Total Protein Stain.
Find a linear trendline for the target and Revert 700 Total Protein Stain that meets your requirements for correlation strength.
You will probably need to iteratively exclude high and low points from each trendline until you find a range of data points that produces an appropriate linear range.
Determine the median concentration from the combined target and Revert 700 Total Protein Stain linear range.
Based on the median concentration, select a sample concentration for your experiment that will allow your target and Revert 700 Total Protein Stain to be detected within the same linear range.
- Under many circumstances, the median concentration will be a good place to start.
- If you hypothesize that your target will be strongly upregulated or down regulated, you may need to start with a concentration above or below the median to ensure your target and Revert 700 Total Protein Stain are within the same linear range for all your samples.
Step 9. Document validation procedure and results
Document your normalization procedure and results to ensure that all experimental details will be available for publication of your results.
Western Blot Analysis Using Revert™ 700 Total Protein Stain
Quantify the total protein and target as appropriate for your analysis system and software. Instructions for performing a Revert 700 Total Protein Stain analysis in Image Studio Software are provided here: licor.com/revert.
Data Analysis for Revert™ 700 Total Protein Stain
Once you have validated the Revert 700 Total Protein Stain and documented your validation procedure, you are ready to perform your experiment and normalize your data.
Normalization factors must be calculated for each blot. Normalization factors and standard curves cannot be reused between blots.
Quantify target and total protein in each lane.
Calculate the Normalization Factor.

Lane Name Channel TPS Signal for Each Lane Highest Signal Lane Normalization Factor A 700 900 1000 0.9 B 700 700 1000 0.7 C 700 1000 1000 1.0 D 700 800 1000 0.8 Example numbers shown for illustrative purposes only.
Calculate the Normalized Signal to be used for relative quantitative comparisons.

Lane Name Channel Target Signal Lane Normalization Factor Normalized Signal A 800 90 0.9 100 B 800 70 0.7 100 C 800 100 1.0 100 D 800 80 0.8 100 Example numbers shown for illustrative purposes only.
Only use the normalized signal for relative quantitative comparisons.
Although a simple ratio of the target to total protein in each lane will give you the same value proportionally, the ratio does not demonstrate the relationship of the normalized quantification to the raw measurement.
Summary
Internal loading controls and normalization are critical for quantitative immunoblotting. An accurate loading control will display a linear relationship between signal intensity and sample loading. When implemented, an effective normalization strategy should correct for variability in all stages of the immunoblotting process, including the transfer of sample proteins to membrane. It should also be compatible with immunodetection of target proteins and other types of downstream analysis.
References
1. "Instructions for Authors.” The Journal of Biological Chemistry. American Society for Biochemistry and Molecular Biology. Web. 3 March 2016.http://www.jbc.org/site/misc/ifora.xhtml#blots
2. COX IV as a Loading Control licor.com/coxiv
3. Janes KA (2015) An analysis of critical factors for quantitative immunoblotting. Sci Signaling 8(371): rs2.
4. Gomes R, Gilda JE and Gomes AV (2014) The necessity of and strategies for improving confidence in the accuracy of Western blots. Expert Reviews Proteomics 11(5): 549-60.
5. Li X, Bai H, Wang X, Li L, Cao Y, Wei J, Liu Y, Liu L, Gong X, Wu L, Liu S, and Liu G (2011) Identification and validation of rice reference proteins for Western blotting. J Exper Biol. doi: 10.1093/jxb/err084.
6. Eaton SL, Roche SL, Llavero Hurtado M, Oldknow KJ, Farquharson C, Gillingwater TH, and Wishart TM (2013) Total protein analysis as a reliable loading control for quantitative fluorescent Western blotting. PLoS ONE 8(8): e72457.
7. Rocha-Martins M, Njaine B, Silveira MS (2012) Avoiding pitfalls of internal controls: validation of reference genes for analysis by qRT-PCR and Western blot throughout rat retinal development. PLoS ONE 7(8): e43028.
8. Pérez-Pérez R, López JA, García-Santos E, Camafeita E, Gómez-Serrano M, Ortega-Delgado FJ, et al. (2012) Uncovering suitable reference proteins for expression studies in human adipose tissue with relevance to obesity. PLoS ONE 7(1): e30326.
9. Prokopec SD, Watson JD, Pohjanvirta R, and Boutros PC (2014) Identification of Reference Proteins for Western Blot Analyses in Mouse Model Systems of 2,3,7,8-Tetrachlorodibenzo-P-Dioxin (TCDD) Toxicity. PLoS ONE 9(10): e110730.
10. Li R and Shen Y (2013) An old method facing a new challenge: re-visiting housekeeping proteins as internal reference control for neuroscience research. Life Sciences 92: 747-51.
11. Aldridge GM, Podrebarac DM, Greenough WT, and Waller IJ (2008) The use of total protein stains as loading controls: an alternative to high-abundance single protein controls in semi-quantitative immunoblotting.J Neurosci Meth 172(2): 250-54.
12. Greer S, Honeywell R, Geletu M, Arulanandam R, and Raptis L (2010) Housekeeping genes: expression levels may change with density of cultured cells. J Immunol Meth. 355(1-2): 76-9.
13. Lanoix D, St-Pierre J, Lacasse A-A, Viau M, Lafond J, Vaillancourt C. (2012) Stability of reference proteins in human placenta: General protein stains are the benchmark. Placenta 33: 151–156.
14. Yu HR, Kuo HC, Huang HC, Huang LT, Tain YL, Chen CC, et al. (2011) Glyceraldehyde-3-phosphate dehydrogenase is a reliable internal control in western blot analysis of leukocyte subpopulations from children. Anal Biochem 413(1): 24–9.
15. Barber RD, Harmer DW, Coleman RA, Clark BJ. (2005) GAPDH as a housekeeping gene: analysis of GAPDH mRNA expression in a panel of 72 human tissues. Physiol Genomics 21(3): 389-95.
16. Riis P (2001) Molecular Biology Problem Solver: A Laboratory Guide, edited by AS Gerstein. Wiley-Liss, Inc. Chapter 13: 373-97.
17. Bakkenist CJ, Czambel RK, Hershberger PA, Tawbi H, Beumer JH, Schmitz JC (2015) A quasi-quantitative dual multiplexed immunoblot method to simultaneously analyze ATM and H2AX Phosphorylation in human peripheral blood mononuclear cells. Oncoscience 2(5): 542–554.
18. Laskey, R.A. Efficient detection of biomolecules by autoradiography, fluorography or chemiluminescence. Methods of detecting biomolecules by autoradiography, fluorography and chemiluminescence. Amersham Life Sci. Review 23:Part II (1993).
19. Baskin, DG and WL Stahl. Fundamentals of quantitative autoradiography by computer densitometry for in situ hybridization, with emphasis on 33P. J Histochem and Cytochem 41(12):1767-76 (1993).
20. Canetta SE, Luca E, Pertot E, Role LW, Talmage DA (2011) Type III Nrg1 back signaling enhances functional TRPV1 along sensory axons contributing to basal and inflammatory thermal pain sensation. PLoS ONE 6(9): e25108.
21. Meiler E, Nieto-Pelegrín E, Martinez-Quiles N (2012) Cortactin Tyrosine Phosphorylation Promotes Its Deacetylation and Inhibits Cell Spreading. PLoS One 7(3): e33662.
22. Gebhart C, Ielmini MV, Reiz B, Price NL, Aas FE, Koomey M, Feldman MF (2012) Characterization of exogenous bacterial oligosaccharyltransferases in Escherichia coli reveals the potential for O-linked protein glycosylation in Vibrio cholerae and Burkholderia thailandensis. Glycobiology 22(7):962-74.
23. Taylor SC and Posch A (2014) The design of a quantitative Western blot experiment. BioMed Res Intl. doi: 10.1155/2014/361590.
24. Degasperi A, Birtwistle MR, Volinsky N, Rauch J, Kolch W, Kholodenko BN (2014) Evaluating strategies to normalise biological replicates of Western blot data. PLoS ONE 9(1): e87293.
25. Gassmann M, Grenacher B, Rohde B, Vogel J (2009) Quantifying Western blots: pitfalls of densitometry 30(11):1845-55.
26. Schutz-Geschwender A, Zhang Y, Holt T, McDermitt D, and Olive DM (2004) Quantitative, two-color Western blot detection with infrared fluorescence. LI-COR Biosciences: 1-7.
27. Gerk PM (2011) Quantitative immunofluorescent blotting of the Multidrug Resistance-associated Protein 2 (MRP2). J Pharm Toxicol Methods 63(3): 279-82.
28. Subtract Background. ImageJ User Guide Section 29.14.
29. Rasband, W.S., ImageJ, U. S. National Institutes of Health, Bethesda, Maryland, USA, http://imagej.nih.gov/ij/, 1997-2016.
30. P Blainey, Krzywinski M, and Altman N (2014) Points of Significance: Replication Nature Methods doi:10.1038/nmeth.3091
31. Collins MA, An J, Peller D, and Bowser R (2015) Total protein is an effective loading control for cerebrospinal fluid western blots. J Neurosci Methods 251: 72-82.
32. Romero-Calvo I, Ocón B, Martinez-Moya P, Suárez MD, Zarzuelo A, Martinez-Augustin O, de Median FS (2010)Reversible Ponceau staining as a loading control alternative to actin in Western blots. Anal Biochem 401(2): 318-20.
33. Taylor SC, Berkelman T, Yadav G, and Hammond M (2013) A defined methodology for reliable quantification of Western blot data. Mol Biotechnol. 55: 217-226.
Further Reading
Please see the following for more information about QWB analysis.
Western Blot Normalization Handbook
The Normalization Handbook describes how to choose and validate an appropriate internal loading control for normalization.
Good Normalization Gone Bad
Good Normalization Gone Bad presents examples of normalization that have been adversely affected by common pitfalls and offers potential solutions.
Western Blot Normalization White Paper
This white paper comprehensively reviews the literature of Western blot normalization.
Determining the Linear Range for Quantitative Western Blot Detection
This protocol explains how to choose an appropriate amount of sample to load for QWB analysis.
Revert™ Total Protein Stain Normalization Protocol
This protocol describes how to use Revert Total Protein Stain for Western blot normalization and analysis.
Pan/Phospho Analysis For Western Blot Normalization
licor.com/PanProteinNormalization
This protocol describes how to use pan-specific antibodies as an internal loading control for normalization.
Housekeeping Protein Validation Protocol
This protocol explains how to validate an HKP for use as an internal loading control, by demonstrating that HKP expression is stable in the relevant experimental samples.
Housekeeping Protein Normalization Protocol
This protocol describes how to use a housekeeping protein for Western blot normalization and quantitative analysis.
Linear Range Determination in Empiria Studio® Software White Paper
This white paper describes how Empiria Studio Software guides the user through the linear range validation process and documents the results for future use.