Good Westerns Gone Bad
Introduction to Western Blotting
Scientists use Western blotting to identify a protein within a complex mixture. It was first introduced by Towbin et al. in 1979 as a simple method to electrophoretically blot proteins to nitrocellulose sheets (1). Since then, Western blotting methods for immobilizing proteins onto a membrane have become a common laboratory technique. Although many alterations to the original protocol have also been made, the general premise still exists. Macromolecules are separated using gel electrophoresis then transferred to a membrane–typically nitrocellulose or polyvinylidene fluoride (PVDF). The membrane is blocked to prevent non-specific binding of antibodies and probed with some form of detection antibody or conjugate.
Near-infrared fluorescent detection on Odyssey Imagers provides a quantitative two-color detection method for Western blots. The addition of visible fluorescent detection on the Odyssey M Imager and 10-channel Odyssey F Imager further increases multiplex detection options to include three colors.
This document will discuss some factors that may alter the performance of a fluorescent Western blot, resulting in “good Westerns, gone bad.”
Key Factors That Affect Western Blot Results
Membrane
A low-background membrane is essential for fluorescent Western blot success. Background can result from membrane autofluorescence or non-specific binding of antibodies. PVDF and nitrocellulose membranes are typically used for Western blotting applications. There are many brands and vendors for both types of membranes. LICORbio recommends Millipore Immobilon®-FL PVDFand Odyssey Nitrocellulose Membranes.
Test Membrane Background
It is important for you to evaluate membranes before you use them in your Western blot protocol. Cut a small sample of the membrane to test the background of the membrane by itself.
- Image this sample (both wet and dry) to evaluate the level of membrane autofluorescence.
- If possible, include a sample of membrane that is known to work well with your Odyssey Imager, so you can compare background levels.
Membrane Comparison
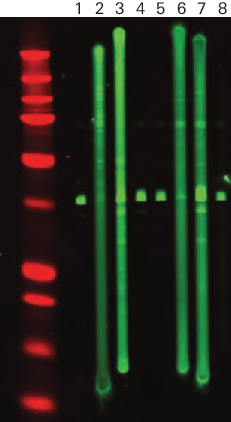
LICORbio has evaluated many different transfer membranes for Western blotting. Examples of membrane performance are shown in Figure 55.
PVDF membranes can display high membrane autofluorescence and more variability in background levels.
Nitrocellulose membranes generally offer lower variation in membrane autofluorescence.
LICORbio has not evaluated all sources of PVDF and nitrocellulose membranes, and lot-to-lot variation can occur. It is important for you to evaluate membranes before you use them.
PVDF Membrane Comparison

Blocking Reagent
No single blocking reagent will be suitable for all antigen-antibody pairs.
Many different sources and types of blocking reagents are used for Western blot applications. Antibody performance can sometimes be compromised by the blocking reagent chosen. Blocking buffer choice may affect antibody specificity and non-specific binding, and can dramatically increase the number of background bands. Excessive blocking (for example, with high concentrations of nonfat dry milk) may cause loss of blotted proteins or mask the desired antibody-antigen interactions (3).
If an antibody fails with one blocking condition, trying another blocker may solve the problem.
Milk-Based Blocking Buffer
Detection reagents may cross-react with certain blocking buffers.
Milk-based blockers may contain IgG that can cross-react with anti-goat antibodies. This can significantly increase background and reduce sensitivity.
Milk-based blockers may also contain endogenous biotin or phospho-epitopes that can cause higher background. It is best not to use milk-based blocking buffers when detecting phospho-targets or other post-translational modifications.
TBS vs PBS Blocking Buffers
Many blocking reagents are available in phosphate buffer (PBS) or tris buffer (TBS) systems. In general, TBS blocking reagents are used for detection of phospho-proteins, because the phosphate present in PBS blocking reagents may competitively bind with antibodies to phospho-proteins. Some phospho-proteins can be detected with PBS-based blocking reagents, depending on the antibody specificity and affinity; however, it is important to optimize the blocking reagent for the specific antibody that is being used for optimal Western blot performance.
Be sure to keep your buffer system consistent throughout the protocol for blocking, antibody dilutions, and washes. For example, if you use a TBS-based buffer system, choose Intercept® (TBS) Blocking Buffer. If you use a PBS-based buffer system, choose Intercept (PBS) Blocking Buffer.
Detergents
Adding detergents to diluted antibodies can significantly reduce background on the blot.
- The optimal detergent concentration may vary depending on the antibodies, membrane type, and blocker used. Keep in mind that some primary antibodies do not bind as tightly as others and may be washed away by too much detergent.
- It is generally best not to expose the membrane to detergent until blocking is complete, as this may cause high membrane background.
Tween® 20
Avoid adding Tween® 20 during the blocking step.
We recommend using a preformulated diluent, such as Intercept® T20 Antibody Diluent, that contains Tween 20.
If you are preparing your own antibody diluent, primary and secondary antibodies should be diluted in a buffer containing a final concentration of 0.2% Tween 20.
Wash solutions should contain 0.2% Tween 20.
SDS
When using a PVDF membrane, adding SDS will dramatically reduce overall membrane background in the 700 nm channel. Use only a very small amount, because SDS is an ionic detergent and can disrupt antibody-antigen interactions if too much is present at any time during the protocol.
SDS should not be used with nitrocellulose membranes.
Do not add SDS to the blocking reagent during blocking.
Diluted primary antibody should not contain SDS.
Wash solutions should not contain SDS.
We recommend using a preformulated diluent, such as Intercept T20 Antibody Diluent, that contains Tween 20 for your secondary antibody.
If you are preparing your own antibody diluent for use with a PVDF membrane, your secondary antibody diluent should contain a final concentration of 0.01 – 0.02% SDS and 0.2% Tween 20.
Primary Antibody
Primary antibodies are produced in a wide variety of species, such as mouse, rabbit, goat, chicken, rat, guinea pig, human, and many others. Primary antibodies from different vendors and sources for the same antigen may perform very differently. It may be necessary to test more than one primary antibody for optimal detection of the target protein in your Western blot system.
Primary Antibody Variation Example
Figure 56 is an example of how different primary antibodies may react.
A) | B) | |||||||||||||||||||||||||||||||||||||||||||||
 |
|
Secondary Antibody
Fluorescent Western blot methods and Odyssey Imagers can detect multiple protein targets simultaneously. Multiplexed detection requires careful selection of primary and secondary antibodies.
If the target proteins are similar in size, the primary antibodies must be derived from different host species so they can be discriminated by secondary antibodies of different specificities (e.g., primaries from rabbit and mouse will be discriminated by anti-rabbit IgG and anti-mouse IgG secondary antibodies).
One secondary antibody must be labeled with IRDye® 680LT or IRDye 680RD, and the other with IRDye 800CW. These secondary antibodies are then detected with an Odyssey Imager in the 700 and 800 nm channels, respectively.
IRDye subclass-specific antibodies offer a special exception to this rule. IRDye Goat anti-Mouse IgG1, Goat anti-Mouse IgG2a, and Goat anti-Mouse IgG2b subclass-specific antibodies enable detection of monoclonal primary antibodies derived from the same species (mouse). IRDye subclass-specific antibodies react only with the heavy (gamma) chain of the primary antibody.
For details and a complete description, refer to Western Blot and In‑Cell Western™ Assay Detection Using IRDye Subclass-Specific Antibodies (licor.com/subclass).
With the Odyssey M Imager and 10-channel Odyssey F Imager, one additional target (for a total of three targets) can be detected using VRDye™ 549 or VRDye 490 Secondary Antibodies in the 520 and 488 nm channels, respectively.
For a complete listing detection channels available for Odyssey Imagers, refer to licor.com/DetectionReference.
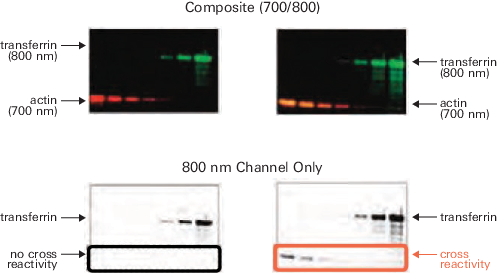
Highly Cross-Adsorbed Secondary Antibodies
Not using cross-adsorbed antibodies may result in increased cross-reactivity (spurious bands that appear in the other detection channel, see Figure 57). LICORbio IRDye® and VRDye™ Conjugated Secondary Antibodies are highly cross-adsorbed and optimized for multiplexed Western blot detection.
Example of Highly Cross-Adsorbed Secondary Antibodies
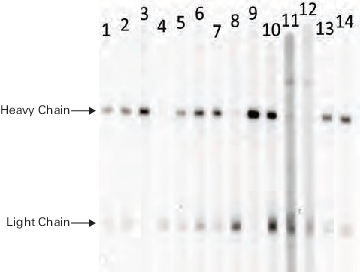
MPX Multiplexer Blotting System for Testing Secondary Antibodies
Many types of secondary antibodies may be used for Western blot detection.
The MPX™ Multiplexer Blotting System can be used to choose the appropriate secondary antibody and optimal dilution. Figure 58 demonstrates the performance of LICORbio IRDye® 800CW Goat anti-Mouse IgG compared to various other secondary antibody options for detection of a mouse IgG primary antibody.
 |
|
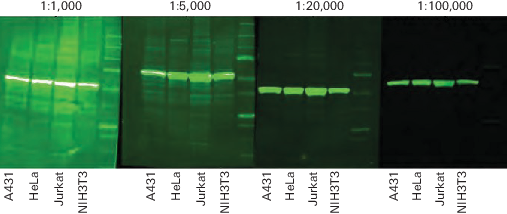
Secondary Antibody Dilution
The amount of secondary antibody used for fluorescent Western blot detection can vary widely. The dilution should be optimized for the primary antibody being used and the preferred appearance of the Western blot. Higher dilutions of secondary antibody provide lower membrane background and fewer background bands than lower dilutions (Figure 59).
| Secondary Antibody | Recommended Dilution Range | Recommended Starting Dilution |
| IRDye® 800CW | 1:5,000 – 1:25,000 | 1:20,000 |
| IRDye 680RD | 1:5,000 – 1:25,000 | 1:20,000 |
| IRDye 680LT | 1:10,000 – 1:50,000 | 1:20,000 |
| VRDye™ 490 | 1:5,000 – 1:15,000 | 1:10,000 |
| VRDye 549 | 1:5,000 – 1:15,000 | 1:10,000 |
If too much secondary antibody is used, bands may be very strong and may show saturation of signal (white pixels in Figure 59). Image display settings can be adjusted to optimize the brightness and contrast, and make background bands less visible.
LI‑COR® Acquisition Software and Empiria Studio® Software can both be used to optimize the appearance of acquired images for a variety of secondary antibody dilutions. However, image display adjustments affect visual presentation only and do not alter the raw data in any way. Empiria Studio also includes a specific Antibody Validation workflow and stores all your validation experiments within the Antibody Validation Library.
Contamination
Many factors can cause contamination and increase the background levels of a fluorescent Western blot. Contamination can appear as a global increase in background, large smears of signal, or speckled blots. Common sources of contamination are listed.
Blue Pen Used on Membrane
| Appearance | Example Image | Solution |
Smeared signal can be seen in the 700 nm channel. | 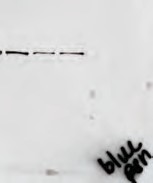 | Use a pencil to write on the membrane. |
Acrylamide Residue on Membrane After Transfer
| Appearance | Example Image | Solution |
Speckles and blotches can be seen in 700/800 nm channels. |  | Carefully rinse off membrane in 1X PBS before it dries. Conditions may need to be optimized to prevent the gel from overheating during transfer. |
Bacterial Growth in Antibodies
| Appearance | Example Image | Solution |
Speckles and blotches can be seen in 700/800 nm channels. | 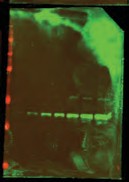 | Replace antibodies. |
Fingerprints
| Appearance | Example Image | Solution |
Blotches can be seen in 488/520/700/800 nm channels where gloved/ungloved hands have touched the membrane. | 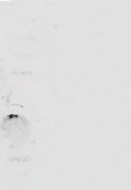 | Only handle membranes by the edges with clean forceps. Be careful not to touch the membrane with your hands or gloves. |
Dirty Transfer Pads
| Appearance | Example Image | Solution |
Blotches can be seen on the blots that align with the transfer cassette holes . | 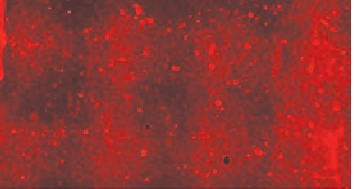 | Cleaning the transfer pads in pure methanol may help, but the transfer pads may need to be replaced. |
Blue Loading Buffer Used During Gel Electrophoresis
| Appearance | Example Image | Solution |
Signal in the 700 nm channel from blue loading dye. |  | Use LICORbio 4X Protein Loading Buffer (P/N: 928-40004). |
Dirty Forceps
| Appearance | Solution |
| Blotches can be seen in 488/520/700/800 nm channels where forceps have touched the membrane. | Do not use rusty forceps. Forceps can be washed with detergent, rinsed with water, and a final rinse with methanol. |
Dirty Processing Containers
| Contamination Source | Appearance | Example Image | Solution |
Coomassie Stain/gel stain/anything blue | In the 700 nm channel, entire membrane dark, smeared signal, or speckles, depending on the amount of stain residue in container. |  | Use different containers for gel staining and Western blot detection. |
| Bacterial growth | Speckles and blotches can be seen in the 488/520/700/800 nm channels. | Wash containers with detergent, rinse thoroughly with distilled water, and a final rinse with methanol. | |
| Acrylamide residue | Speckles and blotches can be seen in the 700/800 nm channels. | Wash containers with detergent, rinse thoroughly with distilled water, and a final rinse with methanol. | |
| Secondary antibody aggregation | Speckles and blotches can be seen in the 488/520/700/800 nm channels. | Centrifuge secondary antibody before use. Place antibody into antibody-diluent and filter. |
Imaging Factors That Can Affect Western Blot Results
Start with a Clean Imaging Bed or Imaging Tray
Always start with a clean scan bed or imaging tray.
If you capture an image and any empty area (not covered by membrane) shows signal in either channel, the scan bed or imaging tray is contaminated. The contamination source may be as simple as dust, or as complex as residual dye.
Carefully follow the cleaning instructions in your Operator's Manual to clean your imager's scan bed or imaging tray.
Remove Air Bubbles
Air bubbles can cause reduced signal detection during imaging. See Figure 60.
Flatten the membrane with a roller (such as P/N: 926-71000) to remove bubbles and excess liquid between the blot and the scan surface. Then cover the membrane with a silicone mat (P/N: 926-70003.
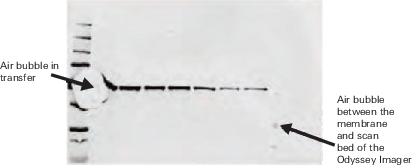
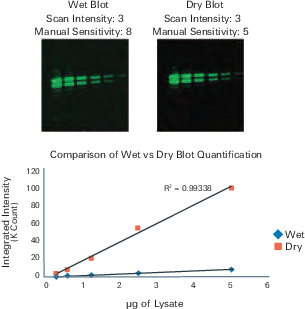
Image Blot Wet or Dry
A Western blot can be imaged either wet or dry on any Odyssey Imager. Typically, the signal is higher when a dry blot is imaged; however, background levels will increase. See Figure 61.
- Membranes can be stored at 4 °C in TBS or PBS for short periods. Always protect membranes from light.
Membranes can be stored dry at room temperature for prolonged storage. Always protect membranes from light.
References
1. Towbin, H., Staehelin, T., and Gordon, J. (1979). Electrophoretic transfer of proteins from polyacrylamide gels to nitrocellulose sheets: procedure and some applications. Proc Natl Acad Sci USA, 76(9), 4350-4354. https://doi.org/10.1073%2Fpnas.76.9.4350
2. Ambroz, K., Zhang, Y., Schutz-Geschwender, A., and Olive, D.M. (2008). Blocking and detection chemistries affect antibody performance on reverse phase protein arrays. Proteomics, 8(12), 2379-2383. https://doi.org/10.1002/pmic.200700676
3. DenHollander, N. and Befus, D. (1989). Loss of antigens from immunoblotting membranes. J Immunol Methods, 122(1), 129-135. https://doi.org/10.1016/0022-1759(89)90343-8