Example Experiment: Detecting Feline anleukopenia Virus in CrFK Cells Using Virus Titration
Background
The In-Cell Western Assay, a quantitative immunofluorescence assay performed using multiwell plates, combines the specificity of Western blotting with the replicability and throughput of an ELISA. The result is a high quality and reliable means to perform many assays, including viral titration.
Traditionally, infectivity of viruses that exhibit cytopathic effect (CPE) has been characterized using assays such as the standard plaque assay (SPA). While effective, these methods can be tedious, time-consuming, and the results are subject to human error. The In-Cell Western Assay is effective for quantifying virus titrations of both cytopathic and non-cytopathic viruses (1).
Experimental Design
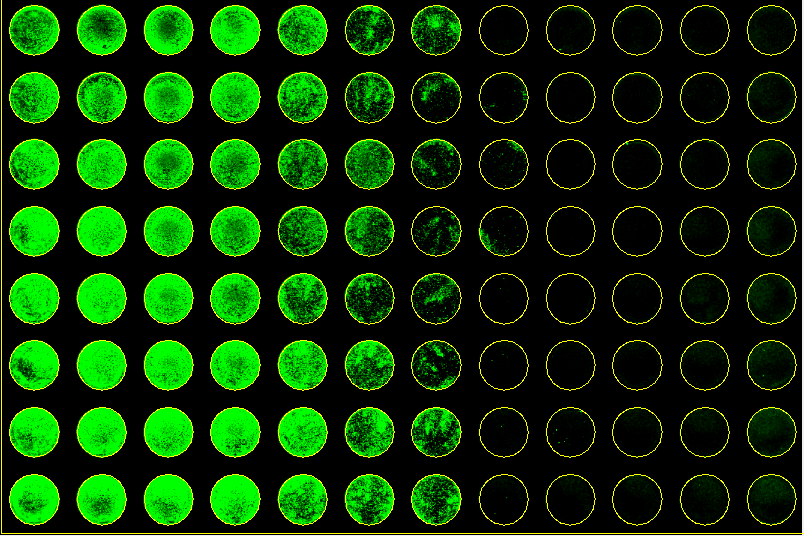
In the following virus titration example, we present a protocol for detecting Feline Panleukopenia (FPL) in Crandall Reese Feline Kidney (CrFK) cells. CrFK cells were seeded in a 96-well multiwell plate then infected with 10-fold dilutions of virus stock. The plate was detected with IRDye® 800CW Goat anti-Mouse Secondary Antibody then imaged on the Odyssey® CLx Imager.
Required Reagents
LI-COR Reagents
- IRDye 800CW Goat anti-Mouse Secondary Antibody (LI-COR P/N 925-32210 or 926-32210)
- CellTag™ 700 Stain (LI-COR P/N 926-41090)
- 96-well multiwell plate with clear bottom (LI-COR P/N 926-19156)
Additional Reagents
- Crandall Reese Feline Kidney (CrFK) cell line (VMRD, Inc.)
Canine Parvovirus (CPV) Mab IgG2a Isotype, (P/N A3B10, VMRD, Inc.)
CPV cross-reacts with FPL.
- Feline Panleukopenia (FPL), Andrea strain (VMRD, Inc.)
- Eagle’s Minimum Essential Medium (EMEM), (ATCC)
- 7% irradiated fetal bovine serum (FBS) (Intermountain Life Science)
- 1X PBS wash buffer
- 80% acetone in water
Prepare Cells
Maintain CrFK cells at 37 °C with 5% CO2 in EMEM containing 7% irradiated FBS.
Infect Cells
- Seed the CrFK cells in 200 µl of media in a 96-well multiwell plate.
- Place the plate on a flat rotator at 14 RPM (e.g., Daigger Model OR-100) for 15 minutes to 1 hour or on a flat surface for 1 hour.
- Incubate at 37 °C with 5% CO2 until ~80% confluency is achieved.
- Remove the media from the wells and refeed with 150 µl of 2% FBS in EMEM.
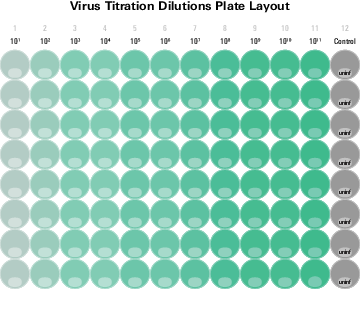
- Add 50 µl of 10-fold dilutions of virus stock to the wells (8 wells per dilution). Keep 8 uninfected wells as the control (Plate Layout ) and add 50 µl of the 2% FBS EMEM to each control well.
- Incubate at 37 °C with CO2 for at least 72 hours.
Wash Cells
- Remove media with a multichannel pipettor by tipping the plate to 75° and sliding the tips down the side of each well until they touch the bottom to avoid dislodging the cells.
- Tip the plate to 75° again and drip 150 µl of 1X PBS down the well sides to the bottom. Remove the wash as seen in Step 1.
- Repeat washing steps once.
Fix Cells
- Add 150 µl of 80% acetone at room temperature (RT) to each well. Replace the lid and incubate in the hood for 15 minutes.
- To prevent wells from drying, remove the acetone from the wells three rows at a time. Add 1X PBS wash to the first set of three rows before removing the acetone from the next three rows. Remove 1X PBS wash only after it has been added to all wells.
- Repeat Step 2 in Wash Cells with the second wash.
Primary Antibody
Dilute Primary Antibody
Dilute the primary antibody:
Canine Parvovirus (CPV) (Mouse; 1:200 dilution in 1X PBS)
Incubate with Primary Antibody
- Tip the plate to 75° and drip 50 µl of the diluted primary antibody down the well sides to the bottom. Tap the plate gently to ensure that the liquid covers the bottom of each well.
- Incubate at 37 °C with CO2 for 40 minutes.
Wash
- Repeat all steps in Wash Cells.
Secondary Antibody
Dilute Secondary Antibody
Dilute the secondary antibody:
IRDye 800CW Goat anti-Mouse (1:800 dilution in 1X PBS)
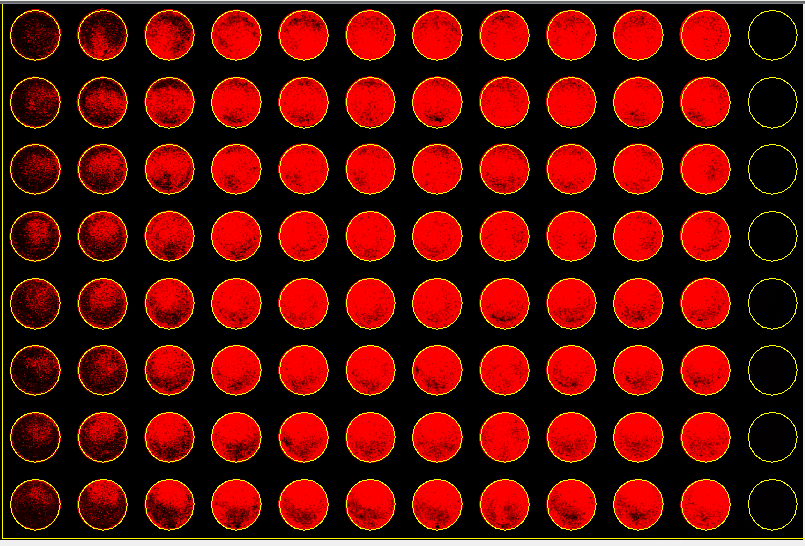
To normalize the number of cells, add CellTag 700 Stain (1:500 dilution) to the secondary antibody but not the uninfected control.
Incubate with Secondary Antibody
Tip the plate to 75° and drip 50 µl of the diluted secondary antibody down the well sides to the bottom. Tap the plate gently to cover the bottom of each well.
For wells that contain CellTag 700 Stain, follow Step 1 but add the diluted secondary antibody without CellTag 700 Stain down the sides of the uninfected wells only. Add the diluted secondary antibody with CellTag 700 Stain to the remaining wells.
Incubate at 37 °C with CO2 for 40 minutes.
Wash
- Remove the secondary antibody with the multichannel pipettor.
- Repeat all steps in Wash Cells to wash wells with 1X PBS twice then with ultrapure water once.
Image
After final wash, remove liquid completely from wells. Turn the plate upside down and tap or blot gently on paper towels to remove traces of liquid. Apply an adhesive plate cover.
Wipe the bottom of the plate with methanol, ethanol, or isopropanol then water. Image the plate.
Plate Layout
Suggested Scan Settings
All settings may require adjustment for optimal data quality. Higher resolutions or scan qualities can be used, but the scan time will increase. Use a focus offset of 4.0.
| Instrument | Resolution | Scan Quality | Intensity Setting (700 nm) | Intensity Setting (800 nm) |
| Odyssey DLx | 169 µM | lowest | Auto Mode | Auto Mode |
Experimental Results
 |  |
| 10-1 | 10-2 | 10-3 | 10-4 | 10-5 | 10-6 | 10-7 | 10-8 | 10-9 | 10-10 | 10-10 | uninfected |
1 | 6937.2 | 6832.8 | 7219.9 | 7939.6 | 6262.2 | 2981.2 | 3111.1 | 570.9 | 742.5 | 684.4 | 647.2 | 893.2 |
2 | 7312.8 | 6506.7 | 6284.5 | 6287.1 | 5042.5 | 2940.7 | 1361.8 | 645.8 | 564.5 | 648.2 | 675.0 | 936.9 |
3 | 8820.1 | 7829.2 | 5790.5 | 5335.6 | 3950.1 | 3463.6 | 1526.2 | 691.0 | 450.3 | 701.7 | 688.6 | 962.7 |
4 | 11546.4 | 9953.4 | 6761.0 | 5924.3 | 3912.6 | 3417.8 | 1251.5 | 903.3 | 447.5 | 558.8 | 732.0 | 1049.0 |
5 | 11242.1 | 9773.4 | 7550.2 | 6149.7 | 4572.2 | 2493.3 | 1628.3 | 452.9 | 405.9 | 581.4 | 864.3 | 1100.9 |
6 | 11092.5 | 9736.0 | 8557.6 | 7501.8 | 6687.4 | 4600.9 | 2011.4 | 555.7 | 561.2 | 623.0 | 804.1 | 1127.8 |
7 | 10396.8 | 10335.7 | 9349.9 | 8725.7 | 8083.4 | 5533.9 | 4165.8 | 657.1 | 800.9 | 730.8 | 818.9 | 1337.2 |
8 | 10579.7 | 9794.2 | 9936.5 | 9878.5 | 7084.9 | 5956.5 | 4516.1 | 583.4 | 667.1 | 739.9 | 872.2 | 1133.0 |
+ | 8/8 | 8/8 | 8/8 | 8/8 | 8/8 | 8/8 | 6/8 | 0/8 | 0/8 | 0/8 | 0/8 | 1067.6 |

References
1. Weldon, S.K., et. al. (2010). Quantitation of virus using laser-based scanning of near-infrared fluorophores replaces manual plate reading in a virus titration assay. Journal of Virological Methods, 168(1–2), 57–62.
Additional Resources
- Kärber, G. (1931). Beitrag zur kollektiven Behandlung pharmakologischer Reihenversuche. Naunyn-Schmiedebergs Archiv Für Experimentelle Pathologie Und Pharmakologie, 162(4), 480–483.