Spec-pH software tour
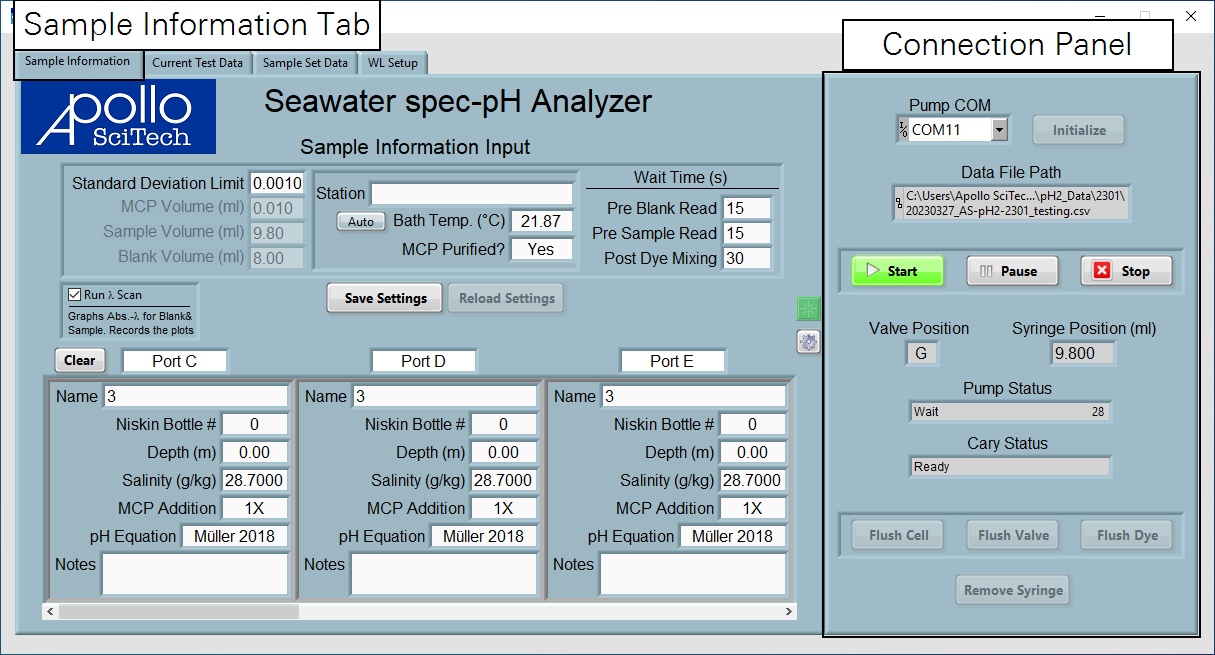
The software that runs on the computer is called Spec-pH2 3.0.1T. Upon startup, it displays the Connection Panel, where you can set communication parameters and initialize the measurements and the Sample Information Tab.
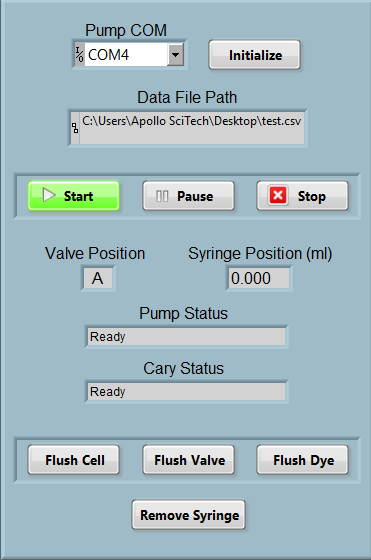
Connection panel
Pump COM: The serial port # that communicates with the LI-5700A control unit pump.
Data File Path: The directory of the data file. You'll be prompted to set the path after you click Initialize.
The buttons (sometimes called Utility Functions) become active after initializing the system. These functions instruct operations of the device during measurements.
-
Initialize establishes communication between the computer, LI-5700A control unit pump, and Cary 60.
-
Start initiates a measurement, after the pump and Cary 60 are ready and all applicable sample information has been entered. Clicking this button after a sample set is started will add a new sample set to be measured after the current set.
-
Pause will pause both the Cary 60 and the pump. You have the choice to resume your sequence.
-
Stop gives two options to stop the measurement. Click Abort to stop all current actions and abort the sample run. It will reset the syringe and valve position , discharge all solutions in the flow cell and will bring the system to idle state. Click Finish sample to delete all the pending samples in the data table but finish the current one.
-
Flush Cell will discharge the solution in the flow cell. This is useful if there are air bubbles in the flow cell, which interferes with the measurements.
-
Flush Valve will clean all 9 sample ports with 3 mL of DI water each and flush the flow cell with DI water. Repeat flushing the flow cell until all the sample (with dye) in the flow cell has been flushed. You can skip any port by de-selecting them. If the analyzer is to be left unused for over 12 hours, flush all 9 sample ports and the flow cell with DI water. If you are placing the analyzer in storage, apply this function three times with the last one drawing no water (all sample tubing in air). Follow the instructions in the pop-up window. This function can also be used to fill all sample tubes with aged seawater and flush the flow cell with aged seawater before the first batch of real samples to minimize any uncertainties that may be introduced with bubbles or mixing of DI water with sample in the sample tube.
-
Remove Syringe gives instructions on how to remove the syringe from the 12-way valve without removing both the syringe and the valve from the pump. Finish all steps in the pop-up message before clicking OK.
Sample information
In the Sample Information Tab, the first collection of parameters describe the sampling station.
- Standard Deviation Limit the standard deviation limit of pH value of the best three repeats of the measurements.
- MCP Volume (ml), Sample Volume (ml), and Blank Volume (ml) set the volume of dye, seawater sample, and sample blank to be drawn during the measurement.
- Station: A name for record keeping. The name is saved in the dataset.
- Auto (button): When selected, the unit uses temperature readings from the probe. Otherwise, you can enter the Bath Temperature.
- Bath Temperature: If you do not select Auto, enter the water bath temperature.
- mCP Purified: Set to yes if the mCP is purified; no otherwise.
- Wait Times: Pre Blank Read, Post Sample Mixing, and Post Dye Mixing are the times to wait between steps.
- Run λ Scan is a check box that, when selected, instructs the device to run a scan from 420 nm to 740 nm and save the curve to a data file.
Port configurations
Information about port configurations describes each sample. Scroll to right to other sample ports. Options are described in Scanning samples.
Current Test Data
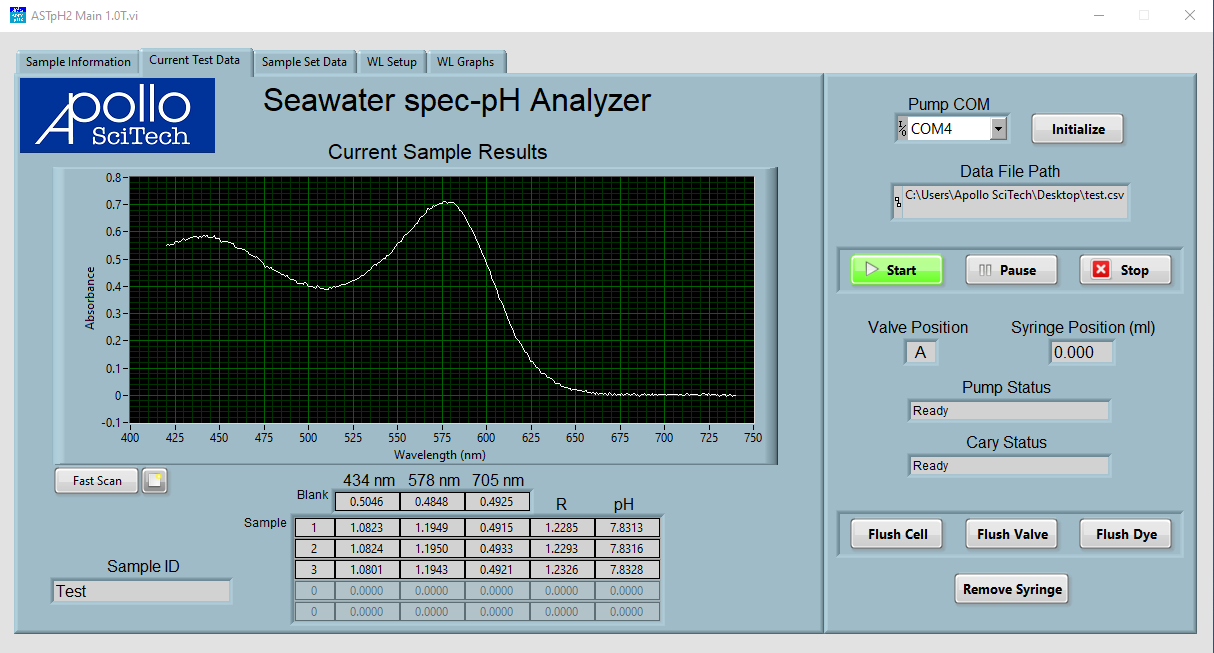
This tab presents results from the current run. The smoothness of the plot can indicate the cleanliness of the optical cell. A jagged plot may indicate that the cell needs to be cleaned. Click Fast Scan to view a hidden tab called WL Graphs.
Sample Set Data
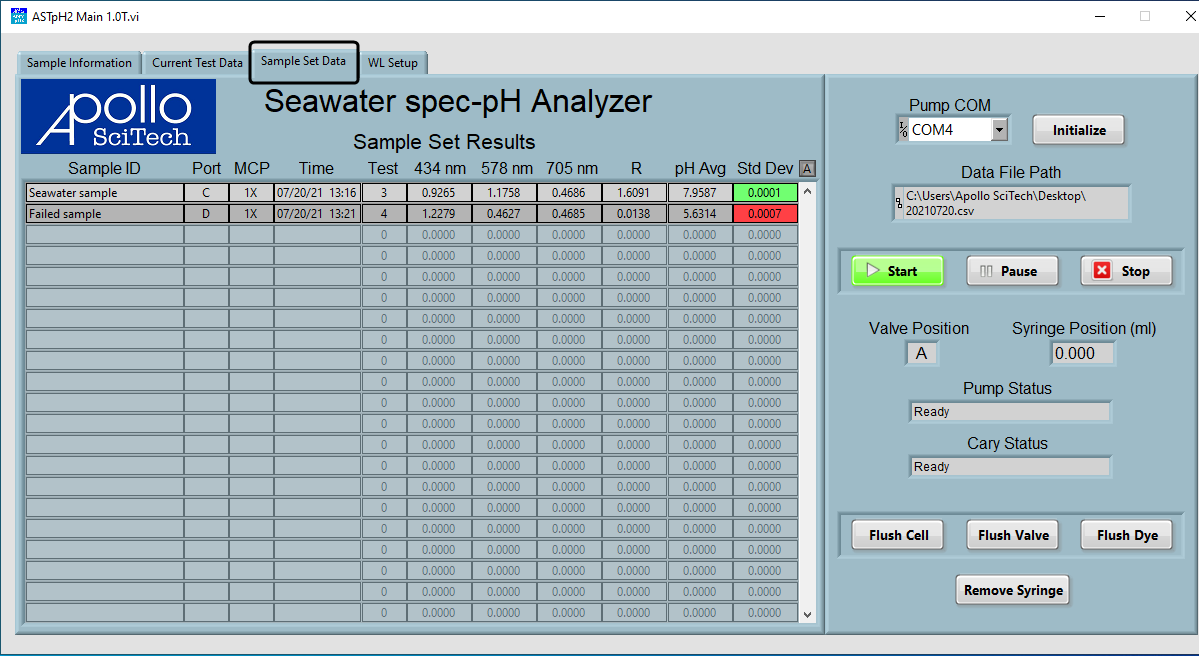
Click the SAMPLE SET DATA tab to see all the samples with results displayed in a data table. Note that test # indicates the last reading of the three closest ones, rather than total number of times the sample was read. Measured mCP absorbance ratios, average pH, and standard deviations are recorded (see ).
WL Scan
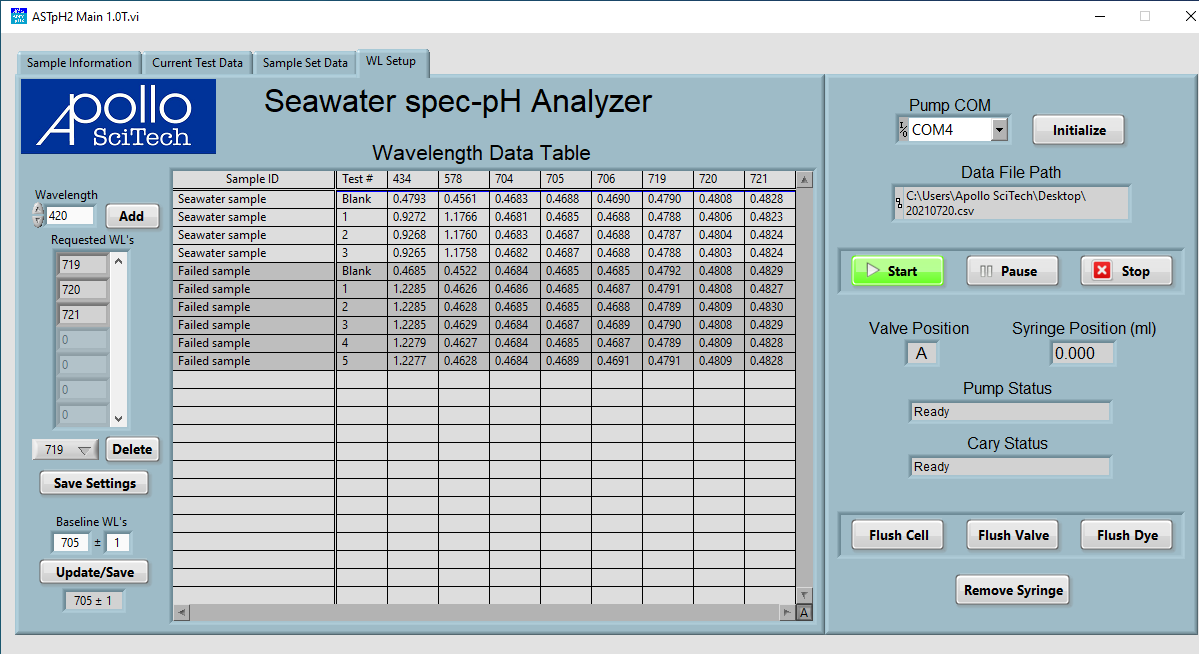
The WL Scan tab presents a table of readings from measurements.
