Using the MultiPhase Flash Protocol
Background Information
What is the MultiPhase Flash Protocol?
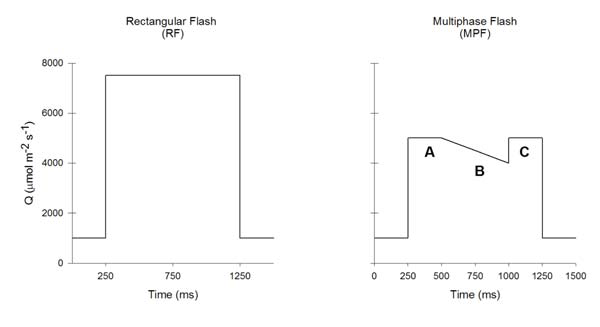
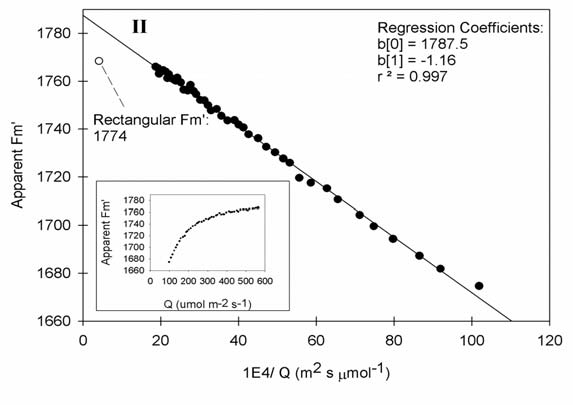
Maximal fluorescence (Fm') is measured in order to estimate the effective quantum efficiency of Photosystem II (ΦPSII) and the rate of electron transport from chlorophyll fluorescence measurements (Genty et al., 1989). Fm' is usually measured with a single saturating, 'multi turnover' flash to reduce the QA-PQ pool (RF method, Figure 27‑32). Multi turnover means that the primary acceptor of PSII, QA, is reduced and oxidized multiple times until the transport chain of QA to PQ is in a reduced state. In many conditions, especially in high-light adapted field plants, it is difficult to achieve full reduction of the QA-PQ pool with the RF method, which results in an underestimation of Fm', ΦPSII, and ETR (Earl and Ennahli, 2004; Markgraf and Berry, 1990). The multiphase flash (MPF) protocol (Figure 27‑32) can be used under conditions when it is difficult to fully-saturate the plant material with a normal, rectangular flash (RF) in order to derive true estimates of Fm', ΦPSII, and ETR (Figure 27‑33) within approximately one second (Loriaux et al., 2006).
Configuring for a MultiPhase Flash
Access the saturating flash parameters in the Flr Editor, f2 level 8 (Figure 27‑34). Once in the editor, navigate to the flash parameters.
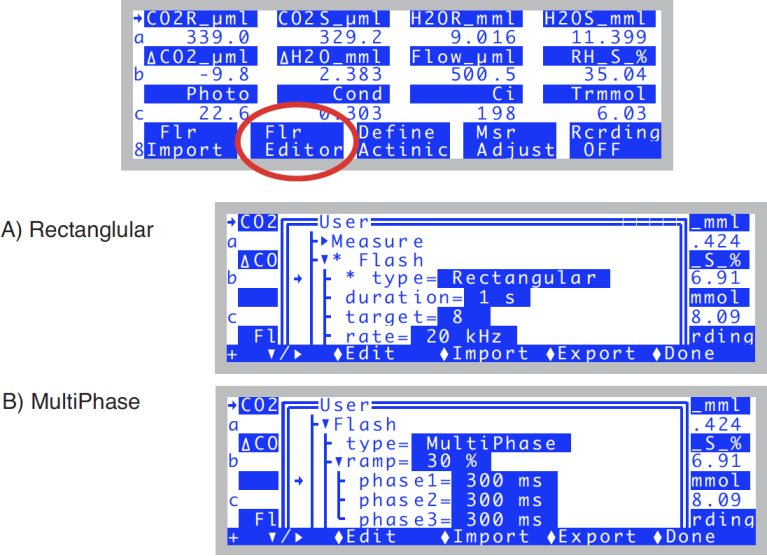
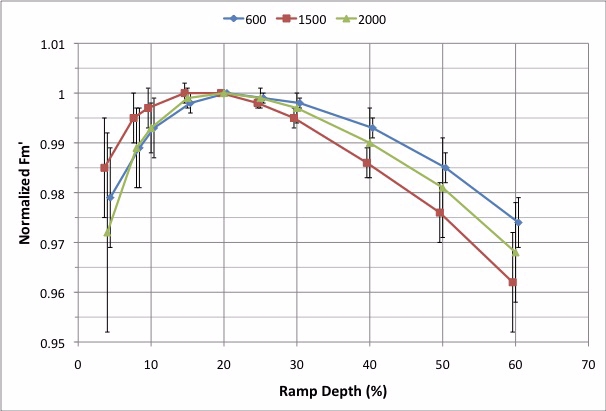
Flash Type determines whether the saturating flash is rectangular or multiphase. When set as multiphase (B in Figure 27‑34), ramp is the percentage drop in the maximum saturating intensity during phase 2 of the flash. A good starting ramp value is typically 15 to 40% (Figure 27‑35).
The length of the saturating flash is determined via the duration (rectangular, A in Figure 27‑34) or the phase1 ... phase3 settings (multiphase, B in Figure 27‑34). Information on setting the multiphase timing is in Making Measurements.
Target is the maximum light intensity of a rectangular flash, or the first and third phases of a multiphase flash. Rate is the measuring light modulation frequency during the flash, and should always be set to 20 kHz. Filter is the signal averaging during a flash; a good starting value is 50 Hz. Autosave allows the saturating flash file to be automatically saved.
Making Measurements
- Measure a rectangular flash on an example leaf
- In order to set-up the multiphase saturating flash parameters, you must first perform a normal, rectangular flash on a representative, example leaf. Check the shape of this flash for the following characteristics:
- A) Square PPFD: In order to check the next two characteristics, the incident PPFD must have a square shape. Start with a flash intensity of 9 or less. At a starting intensity of 10, the LCF does not have head room to boost the light intensity to make it square. Non-square and square flash examples are displayed in Figure 27‑36. The lines (PPFD values) should be reasonably horizontal in the 10% and 1% views. If the flash PPFD is not very square, then run the Square Flash Calibration routine (Square Flash Calibration). If the flash PPFD is still not square after calibration, then try a lower flash Target.
-
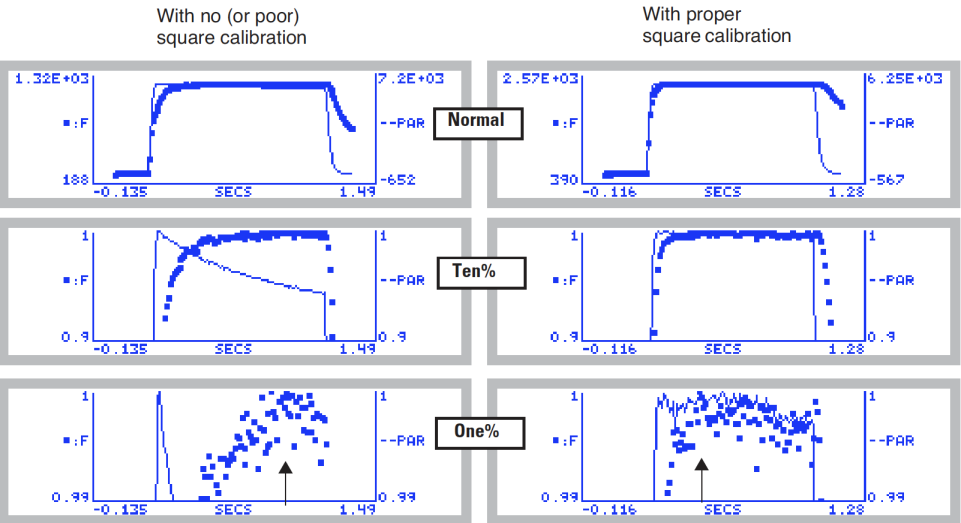
Figure 27‑36. Comparison of unsquared (left) and squared (right) flashes. Each is shown with a normal (top) view (press G), a view zoomed to the top 10% (press T), and a view zoomed in to 1% (press O). Arrows indicate what would be the minim time for Phase 1 in a MultiPhase Flash. - B) QA-PQ pool reduction plateau (Phase 1 timing): With a square PPFD flash, there is a minimum time required to achieve a fluorescence plateau, or a quasi-filling of the QA-PQ pool. This minimum time determines the phase 1 timing of the multiphase flash, and varies with species and light history. A good starting value is 300 milliseconds, but the minimum time required should be checked for each type of leaf being measured in a study. The minimum time required for phase 1 in the two flashes shown in Figure 27‑36 is indicated with arrows.
- C) NPQ quenching (Phase 1-3 duration): With a square PPFD flash, check the maximum time to ensure fluorescence is not being quenched too soon by nonphotochemical quenching. The fluorescence signal should remain at its maximum till the end of the flash. If the flash is too long, quenching will reduce the fluorescence signal.
- For example, looking again at Figure 27‑36, the squared flash on the right shows no evidence of quenching. The one on the left, however, starts to drop toward the end, but it is not clear if that is due to quenching, or to the dropping light in the non-squared flash (Hence, the problem with non-square flashes). A leaf that will require a lengthy Phase 1 is shown in Figure 27‑37. Clearly, after 1 second, the fluorescence has not reached a stable maximum.
-
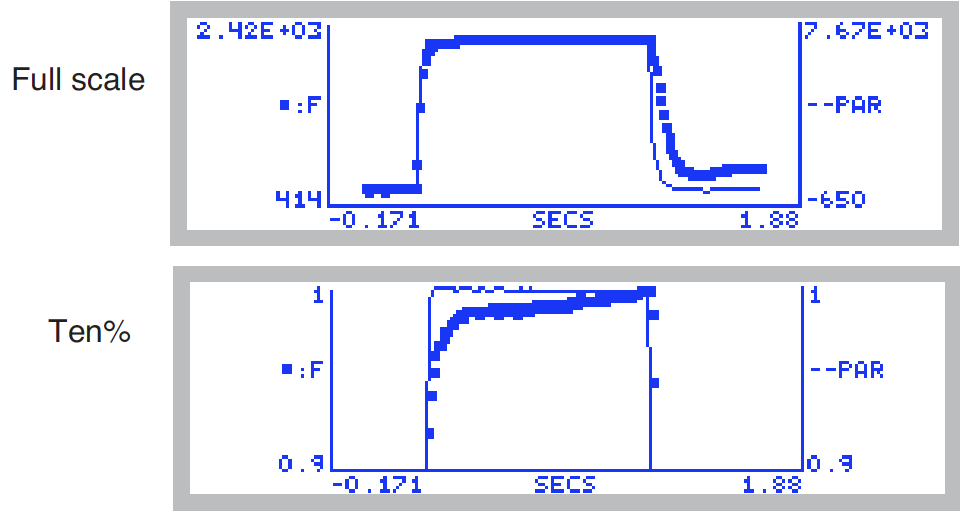
Figure 27‑37. Two views of a slow leaf. The ten% view shows that after 1 second, it had not reached a maximum. - An example of a flash that is too long is shown in Figure 27‑38. Notice the drop in the fluorescence signal after 400 ms as indicated with the vertical lines. The phase timing of the multiphase flash on this leaf should be adjusted so the entire flash duration does not exceed 400 ms.
-
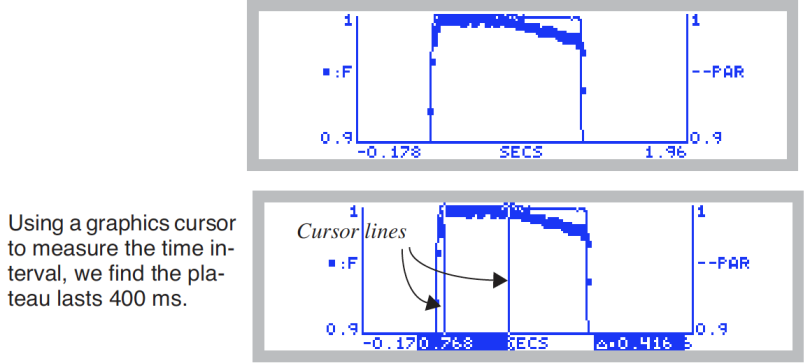
Figure 27‑38. Selecting maximum times for a flash. The entire flash is 1 second, but the stable plateau is only 400 ms. - To learn how to use the graphics cursors, see Measuring Graphs on page 12-21 in the instruction manual.
- Set the multiphase flash timing
- Adjust the flash timing for phases one through three as determined from Step one. These are set in the Flr Editor menu, f2 level 8. Change the flash type to multiphase, and expand the ramp settings in order to adjust the timing of each phase (Figure 27‑34).
- Apply and analyze an example multiphase flash
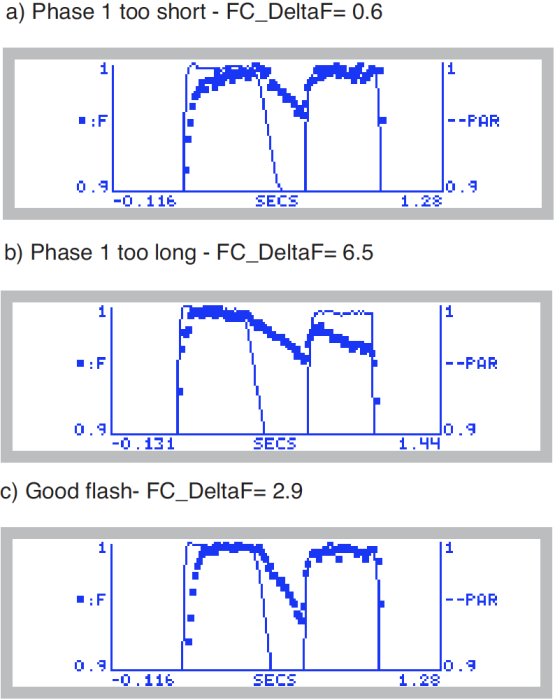
- Once a square flash is performed on an example leaf and the timing has been adjusted, perform a multiphase flash on the example leaf. Look at the shape of the flash, as well as the flash details. The first phase should have a maximum fluorescence plateau before the second phase ramp begins. The ramp should be sufficiently large to have plenty of points to fit the regression. Finally, the last phase should agree well with the regression (FC_DeltaF or Check < 0) and have the same or lower maximum fluorescence as the first phase.
- Figure 27‑39 shows data from three MPFs, two poor and one good.
a) Phase one too short: The first example shows an MPF in which the first phase is too short. The phase one fluorescence did not reach a good maximum before the second phase ramp began. In addition, the third phase has a slightly higher maximum fluorescence than the first phase, which is also an indication that the first phase was too short.
b) Phase one too long: The second example shows an MPF in which the first two phases are too long. The phase three data are much lower than phase one. The large negative FC_DeltaF is another indicator the first two phases’ timing needs to be shortened.
c) Good MPF: The first phase has a nice plateau before the second phase began, and the third phase's maximum fluorescence agreed well with the first phase. The small FC_DeltaF confirms that the phase timing is appropriate.
