What's new in version 5.x
SoilFluxPro Software version 5.x introduces support for measurement of fluxes of CO2 isotopes from soil. Isotope data provided by the LI-7825 can be evaluated using the Keeling method or the Slope method.
New Isotopes section
Data from the LI-7825 CO2 Isotopes/NH3 Trace Gas Analyzer include measurements of CO2 isotopologues. SoilFluxPro Software can evaluate this data using two methods: Slope Regression and Keeling Regression. To use these features, the data must include the major and minor gases.
The Isotope tab allows the assignment of a Major Gas and Minor Gas for the regression.
- Major Gas: The major species to use for the regression calculation. Use total CO2 measurements from the dataset and 12C_CO2 from the LI-7825.
- Minor Gas: The minor gas species to use for the regression calculation. Use Delta13C and 13C_CO2 from the LI-7825.
- Standard: Isotopic standard value. Only relevant to the Slope method. Default value is 0.0112372.
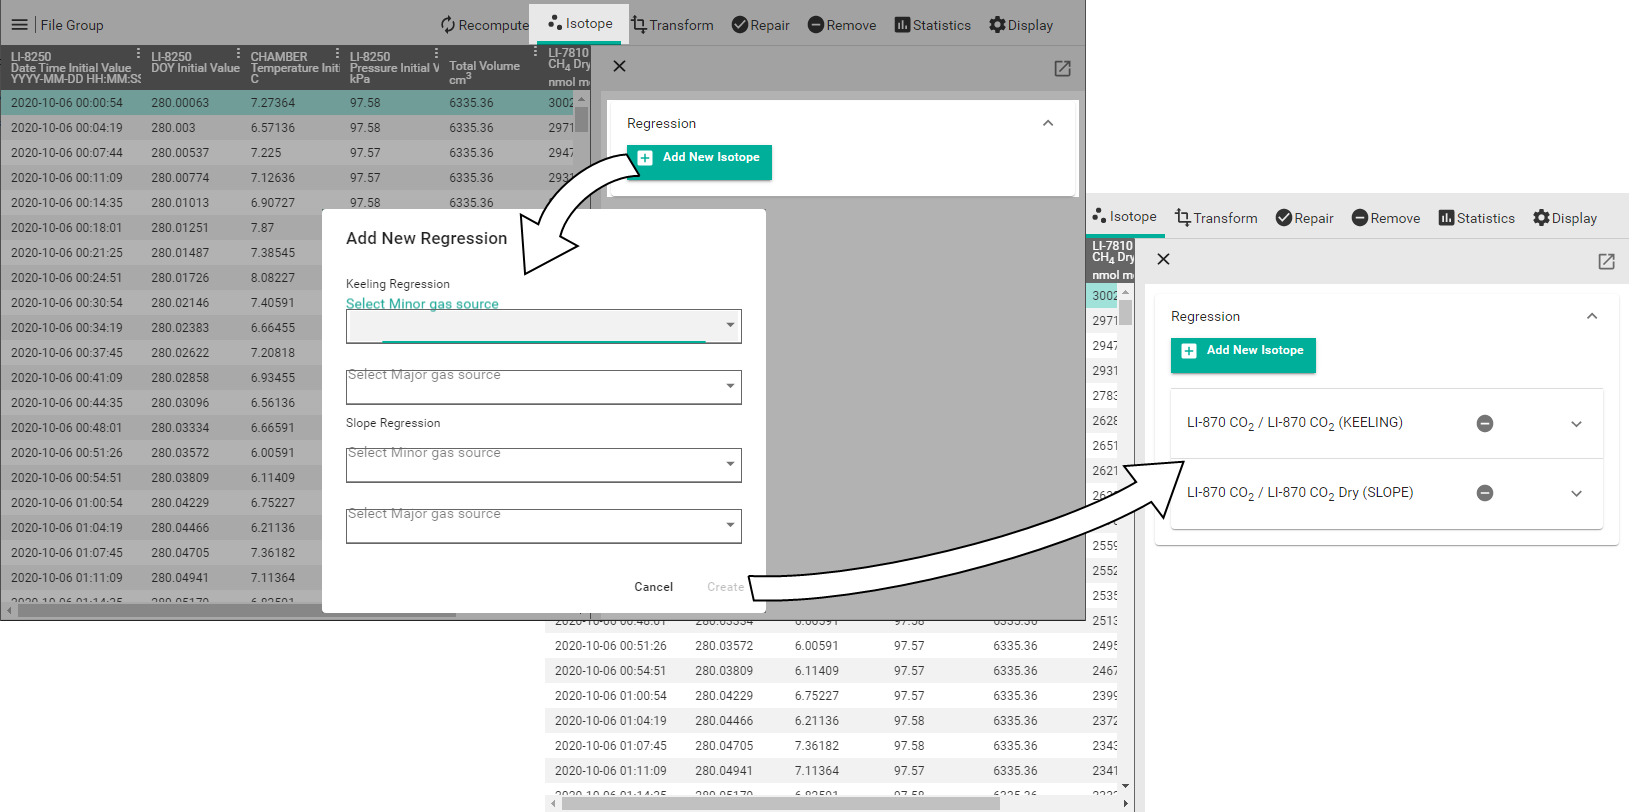
To add a new regression:
-
Select a Major Gas and Minor Gas from the available variables, then click Create.
-
Two new regressions are created - Keeling and Slope.
For each regression, the deadband and stop time can be optimized.
Regression options
Each Regression object presents options - expand the object to view them.
Which observations? If Selected is chosen, SoilFluxPro will display a plot and table of data, along with options to adjust the parameters for the measurement selected in the data display. If All is chosen, SoilFluxPro will show options that can be adjusted for all measurements.
Apply button: Click to Apply changes.
Revert button: Click to discard and revert to the prior state.
Metadata: The Deadband, Stoptime, and Standard are configurable.
Plot: Major gas over Minot gas (or 1/Minor Gas) is displayed when a single observation is selected. The graph shows the deadband (vertical green line). You can adjust the deadband by clicking and dragging the line. It also shows the stoptime (vertical red line). You can adjust the stoptime by clicking and dragging the line. The regression fit is shown in green.
Table: Shows parameters when a single observation is selected.
