Understanding the Wind is Critical to Successful Trace Gas Research
The Earth Systems Observation Group, part of the Los Alamos National Laboratory (LANL), conducts field campaigns that attempt to characterize methane leaks from oil and gas infrastructure. This initiative also considers methane emissions from dairies and other biogenic sources using sensor arrays equipped with trace gas analyzers, sonic anemometers, and other meteorological sensors.
The data obtained by these sensors enables the team to leverage physics-based models to improve field sampling methods, and vice versa. These efforts serve to characterize the movement and interactions of emissions in the atmosphere and, in turn, the potential effects that they might have on the environment.
A contingency of LANL’s Earth Systems Observation Group recently returned from Houston, Texas, where they were part of a program that investigated aerosol impacts on the chemistry and dynamics of cloud formation in the Houston area.
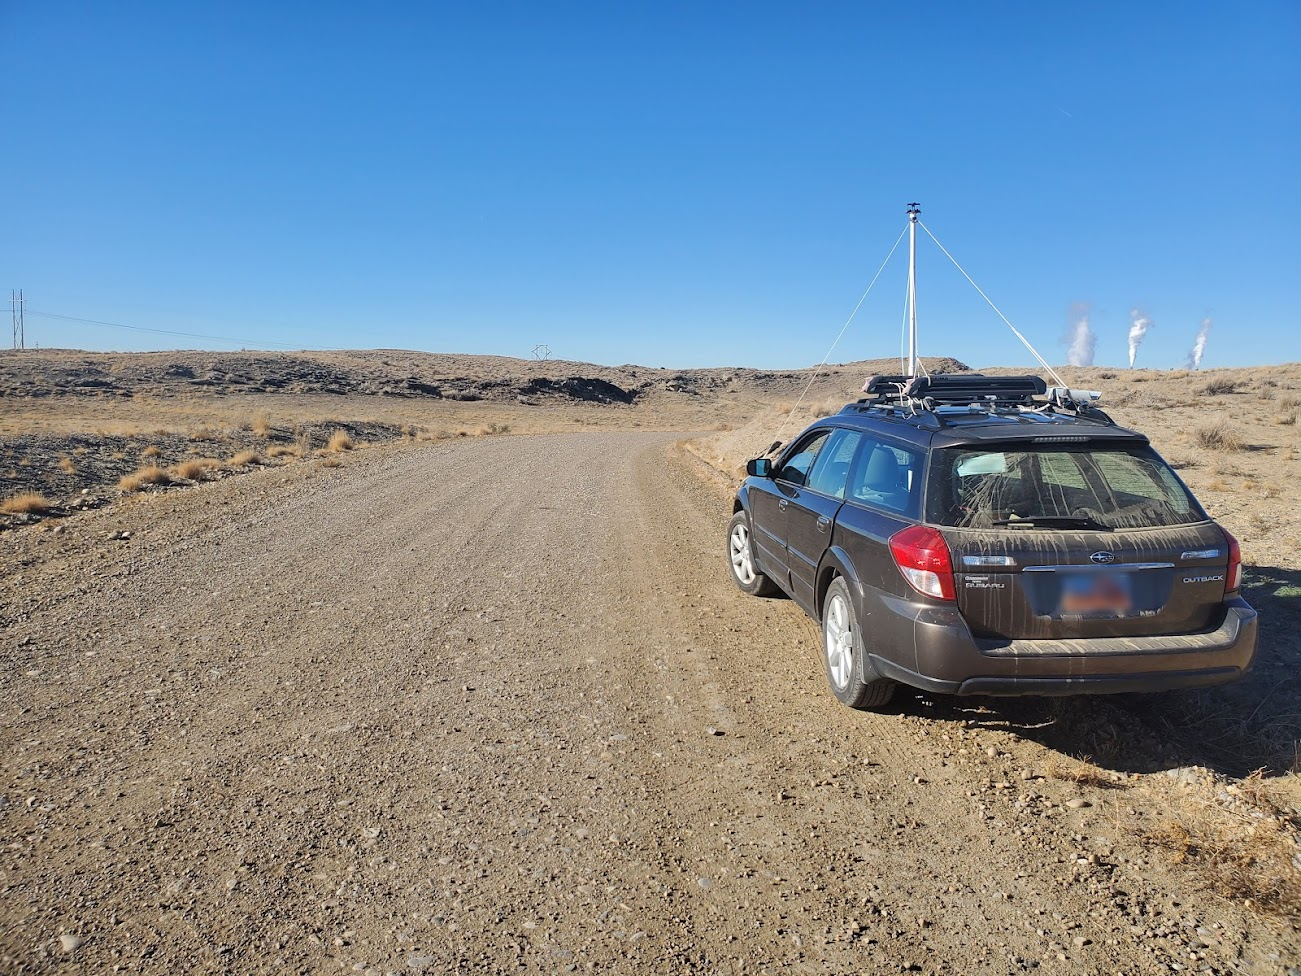
The team used an array of sensors enclosed in a shipping container and a TriSonica® Mini Wind and Weather Sensor installed on top of the container to measure gases in air, wind direction, wind speed, air temperature, air pressure, and relative humidity. That data, which includes in situ aerosol and trace gas measurements, was combined with data from a TriSonica® Wind and Weather Sensor to identify the origin of the gases. In addition to stationary measurements provide by the container array, the team outfit a vehicle with sensors and drove it around the Houston area to identify aerosol and greenhouse gas emissions from refineries and other sources.
Aaron G. Meyer, a trace gas specialist with the Earth Systems Observation Group, points out, “In characterizing methane and other hydrocarbon emissions from oil and gas infrastructure, trace gas analyzers can give us continuous volumetric concentrations in the air of methane and ethane and other hydrocarbon species. However, to go from a concentration that you may be measuring in a plume downwind of a source to an actual quantifiable emission flux, the wind data is as important as the trace gas concentration data because of the atmospheric dynamics that are at play.”
Researchers have found that the downwind characterization of emission sources can vary dramatically based on existing wind conditions. A day with good conditions for measuring a source downwind, in terms of the wind speed and direction, will appear different in terms of the concentrations that the trace gas analyzers are reporting compared to a day with higher or lower wind speeds. So, when calculating for target gas concentrations—whether applying a basic atmospheric dispersion equation or performing more complicated dispersion modeling and turbulence profiling—wind speed and direction are critical variables.
The team is quick to point out that wind data is not only the wind, but the wind, temperature, and pressure. Meteorological characteristics are a critical part of the equation. Meyer clarifies, “In the absence of wind data, any kind of quantification of wind and atmospheric flux with just a trace gas analyzer would be basically impossible. So, when we’re doing research on something like how much methane is coming out of a coal vent shaft in the San Juan Basin, having accurate wind measurements from multiple points is critical.”
“Any situation where one of your goals is to characterize the location of where a source is coming from is inherently tied to wind direction because of atmospheric transport, since the dispersion of gas or aerosol sources are directly tied to the characteristics of the wind,” says Meyer. “While a smoke plume from a wildfire behaves differently from a methane plume from a wellhead, the underlying dynamics are the same and require accurate measurement of the wind.”
“Our field campaigns always come back to wind characterization,” states Meyer. “It is such an important factor in finding where potential sources are coming from and being able to quantify their size. All of that is contingent upon having accurate wind data.”

Purchase Online
Get a Quote